Markets | NGI All News Access | NGI The Weekly Gas Market Report
Natural Gas Trading Last Year Reached Highest Level Since 2011, Analyst Says
The amount of natural gas traded in the United States increased in 2017 for the third year in a row, reaching its highest level since 2011, according to an analysis of FERC Form 552 submissions by Cornerstone Research.
For the seventh consecutive year, the ratio between index-priced transactions and reporting-eligible, fixed-price transactions widened, as the result of a 2% increase in index-priced transactions and a 13% decline in fixed-price transactions potentially reportable to indices, according to a report released by Cornerstone Wednesday.
“We have been seeing a shift from fixed-price natural gas to index-priced natural gas at reporting companies for a while,” said Greg Leonard, a Cornerstone Research senior advisor and co-author of the report. “In 2017, however, we had the largest volume of index-priced transactions and the lowest volume potentially reported to indices since the inception of Form 552 reporting.”
Last year, the industry brainstormed ways to encourage more companies to report fixed-price and physical basis trades amid growing numbers of indexed deals, and debated mandatory price reporting for natural gas marketers.
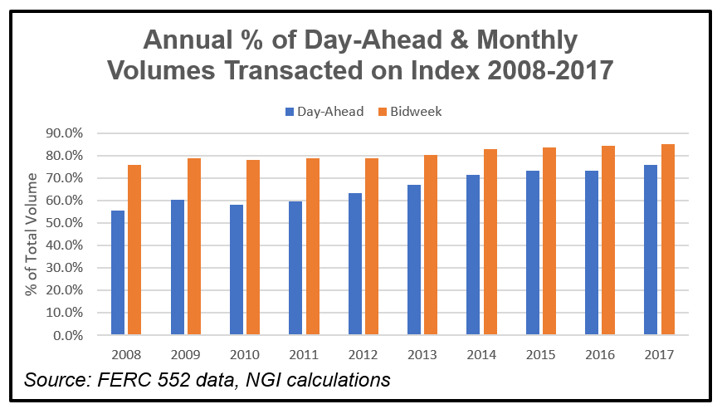
Cornerstone reported trading volumes on 2017 Form 552 submissions rose slightly to 131,296 TBtu, transacted by 678 respondents, 33 fewer than in 2016. The 20 companies with the largest transaction volumes — both purchases and sales — accounted for 44% of total reported volume. As a percentage of Form 552 volumes, next-day transactions have been steadily replacing next-month transactions, possibly reflecting a change in industry contracting and risk management practices, according to the report’s authors.
Aggregate trading of natural gas contracts on the two main futures exchanges increased slightly in 2017, Cornerstone said, with CME Group Inc. trading increasing for the third year in a row (by 8.7%) and Intercontinental Exchange Inc. trading decreasing by 3.5%. CME attributed the rise in natural gas contracts traded on its platform to “higher price volatility caused by shifts in supply and demand in the underlying markets,” Cornerstone said.
The natural gas fixed-price volume potentially reported to price-index publishers saw the largest year-over-year drop since 2014, according to the report.
Cornerstone analysts said the volume of transactions in 2017 indicates that, on average, a molecule of natural gas was traded through about 2.3 transactions from production to consumption.
“Annual marketed production has remained stable for the last three years, up just 1.2% in 2017,” the analysts said. “While only a slight increase over 2016, marketed production set a record high in 2017 (32,476 TBtu).”
An NGI survey of leading natural gas marketers in North America earlier this year found a 2% decline for full-year 2017 compared to 2016 sales. Overall declines that had plagued marketers earlier in 2017 were reversed in 4Q2017 and again in 1Q2018, when participants in the NGI survey sold 8.58 Bcf/d (8%) more gas than in the same period a year earlier.
The NGI survey ranks marketers on sales transactions only. The Federal Energy Regulatory Commission’s Form 552 tallies both purchases and sales.
© 2024 Natural Gas Intelligence. All rights reserved.
ISSN © 1532-1231 | ISSN © 2577-9877 | ISSN © 1532-1266 |