2Q2018 Sales Up 9% in Third Straight Increase for Top North American Natural Gas Marketers
An upward trend in natural gas sales which began three quarters earlier continued into the second quarter, with 25 leading marketers adding 9.20 Bcf/d (9%) to their total compared with the same period last year, according to NGI‘s 2Q2018 Top North American Natural Gas Marketers rankings.
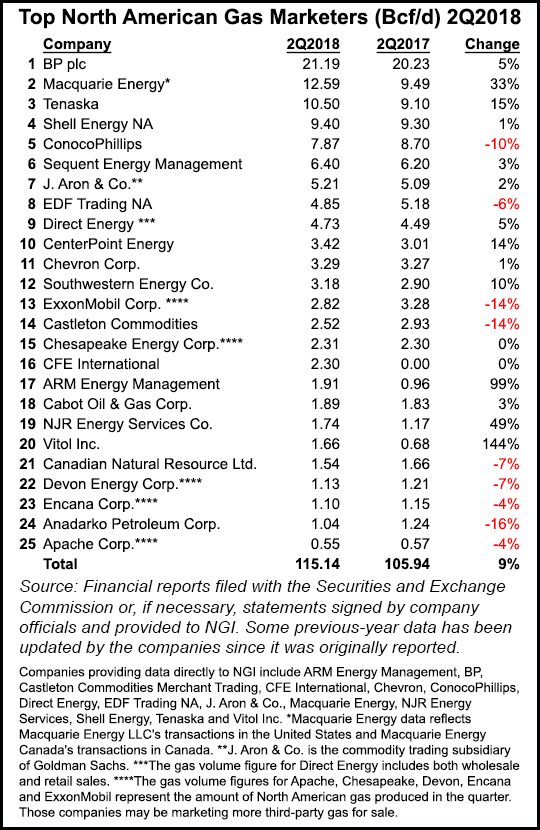
Participating gas marketers reported combined sales transactions of 115.14 Bcf/d in 2Q2018, compared with 105.94 in 2Q2017. Eight of the survey’s top 10 marketers, including the top four, and 16 companies overall reported higher numbers in 2Q2018 than in the year-ago period.
The 1Q2018 increase follows an 8% increase in sales of natural gas reported by marketers in 1Q2018 compared with 1Q2017 and a 7% increase in 4Q2017 compared with 4Q2016.
Natural gas sales may in part be following the lead of a resurgent U.S. economy. The gross domestic product grew 4.1% in the second quarter, its best pace in four years, and the nationwide unemployment rate has hovered at or just below 4% since April, according to the Bureau of Labor Statistics.
The rise in 2Q2018 marketed volumes came as no real surprise, thanks to strong fundamentals on both the supply and demand side, according to NGI’s Patrick Rau, director of Strategy & Research.
“2Q2018 demand was up pretty much across the board versus the second quarter of 2017, and production set new daily records in the second quarter of this year. There is simply more U.S. gas to market these days,” Rau said.
Lower 48 gas production has averaged 8 Bcf/d higher so far this year compared with the same period in 2017 and, as it has since the Marcellus and Utica shales burst onto the scene nearly a decade ago, it is the Northeast ruling the supply growth roost, according to RBN Energy LLC analyst Sheetal Nasta. But the Marcellus and Utica are in the midst of another major inflection point, Nasta wrote in a recent blog post.
“After years of perpetual pipeline constraints, pipeline utilization data indicates that some Northeast takeaway pipelines have a little bit of capacity to spare — a trend that has major implications for regional pricing relative to downstream markets. At the same time, more pipeline expansions are on the horizon that promise to bring on even more gas supply from Marcellus/Utica producers,” Nasta wrote.
More takeaway from the region could come from Rover Pipeline, which last month was authorized to place its Burgettstown and Majorsville laterals into service, and the 1.7 million Dth/d Atlantic Sunrise expansion, which Transcontinental Gas Pipe Line Co. LLC plans to place into full service by next Monday (Sept. 10).
Pipeline flows and spot prices indicate that Northeast constraints “are easing and for the first time in a long time, there are small volumes of capacity available on several key takeaway pipelines,” Nasta wrote.
Longtime No.1 BP plc led the charge, reporting 21.19 Bcf/d in 2Q2018, a 5% increase compared with 20.23 Bcf/d in 2Q2017. It was a positive quarter for BP, which reported 2Q2018 U.S. gas volumes increased to 1.744 Bcf/d from 1.576 Bcf/d a year earlier, and delivered sharply higher second quarter profits. In July, BP high-graded its portfolio with a $10.5 billion transaction to take nearly all of BHP’s Lower 48 portfolio.
For a third consecutive quarter, Macquarie Energy reported the largest increase in the survey, this time a 33% increase to 12.59 Bcf/d. The company’s sales have been boosted by its purchase last year of Cargill’s North American Power and Gas trading business. Macquarie was No. 5 in NGI‘s analysis of 2016 Form 552 buyer and seller filings with FERC; Cargill was No. 47 in NGI‘s analysis of 2015 Form 552 filings, buying and selling 669.8 Tbtu. The NGI survey ranks marketers on sales transactions only. The Federal Energy Regulatory Commission’s Form 552 tallies both purchases and sales.
Tenaska also saw a significant increase compared with the year ago period, reporting a 15% leap to 10.50 Bcf/d. Shell Energy NA was No. 4 in the survey with 9.40 Bcf/d, a 1% increase compared with 2Q2017.
The outlier in the top 5 was ConocoPhillips, which reported 7.87 Bcf/d, a 10% decline compared with 8.70 Bcf/d a year earlier. ConocoPhillips declining volume was likely because of asset sales, Rau said. The super independent reported lower overall second quarter production, but unconventional output surged, leading it to raise 2018 guidance and increase capital expenditures to take advantage of higher-than-expected crude oil prices.
EDF Trading NA was No. 8, reporting 4.85 Bcf/d, a 6% decline from 2Q2017.
Other Top 10 companies reporting increases were Sequent Energy Management (6.40 Bcf/d, up 3% from 6.20 Bcf/d), J. Aron & Co. (5.21 Bcf/d, up 2% from 5.09 Bcf/d), Direct Energy (4.73 Bcf/d, up 5% from 4.49 Bcf/d), and CenterPoint Energy (3.42 Bcf/d, up 14% from 3.01 Bcf/d). CenterPoint, a natural gas and electric utility based in Houston, said in April it plans to acquire Vectren Corp. in a deal valued at $6 billion; the deal is expected to close in 1Q2019.
Other highlights of NGI’s 2Q2018 survey include a 1% increase year/year for Chevron Corp. (3.29 Bcf/d), a 10% increase for Southwestern Energy Co. (3.18 Bcf/d), and a near doubling of marketed volumes for ARM Energy Management (1.91 Bcf/d).
Cabot Oil & Gas Corp. reported 1.89 Bcf/d, a 3% increase. NJR Energy Services Co. reported 1.74 Bcf/d, a 49% increase, and Vitol Inc. reported 1.66 Bcf/d, a 144% increase compared with 2Q2017.
CFE International, which wasn’t trading natural gas a year ago, reported 2.30 Bcf/d in 2Q2018. Mexico’s Comision Federal de Electricidad (CFE) has said much of its future lies in trading natural gas through marketing affiliates CFE International and CFEnergia. CFE International, CFE’s international fuel marketing affiliate, in July said it is seeking supply of up to 1.15 Bcf/d into a pipeline system that connects with transmission networks across the border in Chihuahua state.
© 2024 Natural Gas Intelligence. All rights reserved.
ISSN © 2577-9877 | ISSN © 2577-9966 |