Markets | NGI All News Access | NGI Data
NatGas Cash Takes Double-Digit Hits; Futures Down, Then Up Following Storage Stats
It was another bad day at the ranch for natural gas market bulls as quotes for Friday gas withered with broad losses across all market points.
Two pricing locations followed by NGI made gains, and one was unchanged, but all other locations were solidly in the red, some deep into double digits. The NGI National Spot Gas Average shed a stout 10 cents to $1.64.
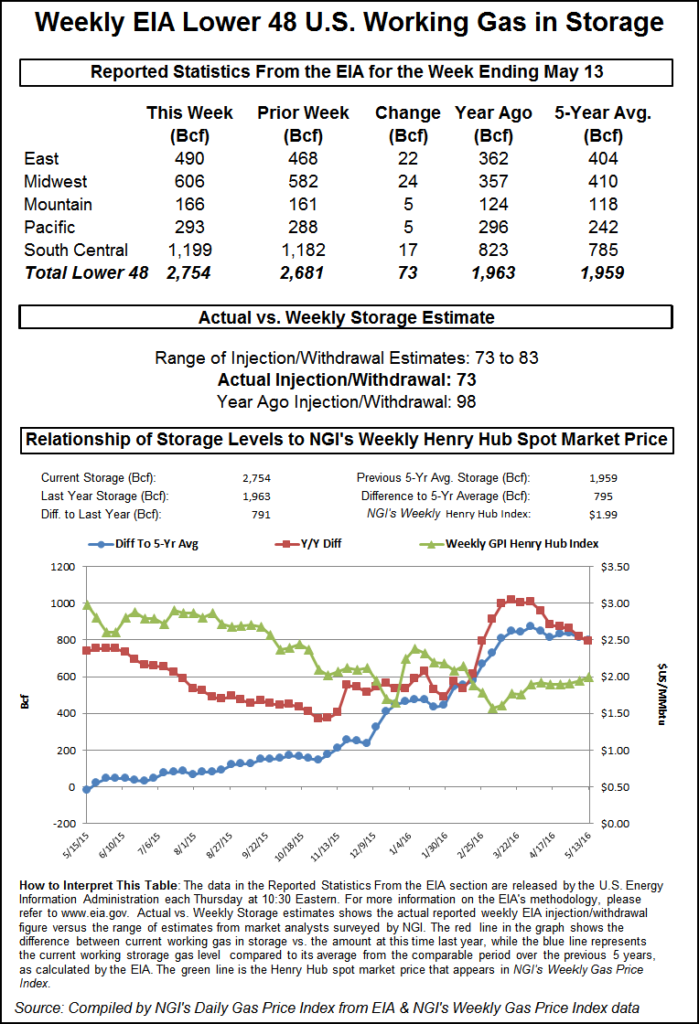
In the futures arena, the primary market driver was the weekly storage report issued by the Energy Information Administration (EIA), which showed a thin build of 73 Bcf for the week ending May 13, about 5 Bcf less than expectations. Prices at first ignored the bullish implications, but by the close June had settled 3.8 cents higher at $2.039 and July had added 6.4 cents to $2.195. June crude oil dropped 3 cents to $48.16/bbl.
When the EIA storage data raced across trading screens, traders were at first unimpressed. June futures dropped to a low of $1.952 shortly after the figures were released, and by 10:45 a.m. June was trading at $1.981, down 2.0 cents from Wednesday’s settlement.
“We were hearing a 78 Bcf increase, but the market was poised to fail when it couldn’t break through that $2.18 to $2.19 area,” a New York floor trader told NGI. “The market should have a halfhearted rally to $2.01 to $2.03 and then close lower on the day.”
“The smaller than expected build in DOE storage implies some tightening of the background supply-demand balance,” said Tim Evans of Citi Futures Perspective. “The data was also bullish relative to the 91 Bcf five-year average refill, trimming the year-on-five-year average storage surplus.”
“We believe the storage report will be viewed as slightly positive. Storage remains at record levels, but the level of injections is below last year and points to a rebalancing over the course of the summer,” said Randy Ollenberger, an analyst with BMO Nesbitt Burns. “We believe that U.S. working gas in storage could exit the summer season at five-year average levels, assuming normal weather.”
Inventories now stand at 2,754 Bcf and are a robust 791 Bcf greater than last year and 795 Bcf more than the five-year average. In the East Region 22 Bcf was injected, and the Midwest Region saw inventories increase by 24 Bcf. Stocks in the Mountain Region rose 5 Bcf, and the Pacific Region was higher by 5 Bcf. The South Central Region added 17 Bcf.
The EIA figures show that the industry has a more than three-quarter Tcf head start to the injection season, which traditionally ends Oct. 31. The question is, where is all the gas normally injected during the summer going to go?
Indications are that major storage operators may have to cut back injections, forcing more produced gas onto the spot market or prompting well shut-ins.
“Several storage facilities have continued to put gas in the ground over the past two months as the spread between cash and the winter months have indicated to do so. The salt dome facilities are nearing last year’s peak levels while others are around the level they usually see come late August/early September,” said EnergyGPS, a Portland, OR-based consulting and risk management firm in a Thursday morning report to clients.
“As of [Wednesday] ANR pipeline posted a notice indicating high inventory levels presently in the storage facility. The notice states this will cause them to limit interruptible injections throughout the summer. They want to make sure they have ample space for system balancing come September and October when there is excess gas swirling around on the grid.
“Currently the facility is around 131 Bcf as of this morning and got as high as 182 Bcf last year. That leaves them only 51 Bcf of room between today and the end of October. At the end of August 2015 that level sat around 141 Bcf. That leaves them with only 10 Bcf of room over the course of the next three months. Assuming 90 days, their rate of injection plummets to around 0.1 Bcf/d. Since the beginning of May, they have been injecting just over 0.6 Bcf/d as they went from 119 Bcf to 131 Bcf in the ground. If their rate reduction holds true and they want to keep some room come September and October, 1/2 Bcf of gas has to find a home elsewhere.
“Neighboring storage facilities are in a similar situation,” EnergyGPS said.
Something has to give, and the latest production data from the EIA is not encouraging. In its Monthly Natural Gas Production Report the Energy Information Administration reported gross withdrawals at 92.02 Bcf/d, including Alaska, for February. That was up from 91.07 Bcf/d in January.
Market bulls can take solace in that one line of thinking has current low prices prevailing only if weather conditions are benign. “In the event we have an ultra-mild summer, and we don’t see much likelihood of that but you can’t rule it out, and if in fact we have a winter next winter that is just as mild as the last winter, and we don’t see much likelihood of that happening, prices will be relatively close to the present forward curve,” EBW Analytics President Andy Weissman said Wednesday in a webinar. “In our view, that is the only scenario in which that would occur.”
In physical market trading spot declines were most pronounced in the Northeast. Deliveries to Algonquin Citygate shed 20 cents to $1.55, and gas on Iroquois, Waddington fell 9 cents to $1.71. Gas on Tenn Zone 6 200L came in 28 cents lower at $1.52.
Packages on Texas Eastern M-3, Delivery fell 7 cents to $1.31, and gas on Transco Zone 6 NY gave up 5 cents to $1.35.
Major market hubs posted significant declines as well. Gas at the Chicago Citygate slid 7 cents to $1.76, and deliveries to the Henry Hub fell 9 cents to $1.82. Gas on El Paso Permian changed hands 15 cents lower, and gas at the PG&E Citygate was quoted 11 cents lower at $1.83.
© 2024 Natural Gas Intelligence. All rights reserved.
ISSN © 1532-1231 | ISSN © 2577-9877 |