Markets | NGI All News Access | NGI The Weekly Gas Market Report
Henry Hub Spot NatGas Prices Seen Heading Higher in 2017 Than December Forecast, EIA Says
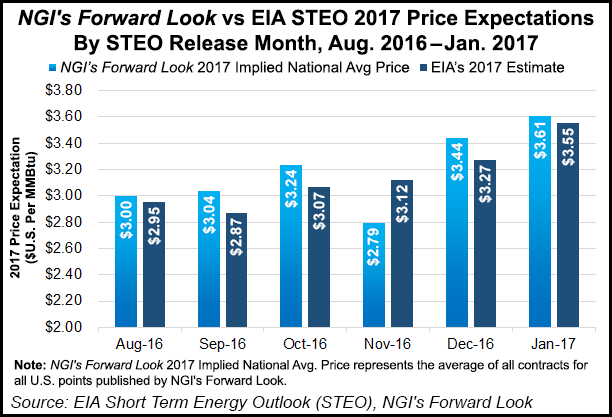
U.S. natural gas prices are looking stronger today than they did in early December, with Henry Hub now expected to average $3.55/MMBtu in 2017, compared with last month’s forecast of $3.27, the U.S. Energy Information Administration (EIA) said Tuesday.
The latest edition of the Short-Term Energy Outlook (STEO) said Henry Hub spot prices, which averaged $2.51/MMBtu in 2016, should climb through 2017 and be more than $1.00 higher year/year. The new forecast, the first to include a call for 2018, sees next year’s prices also higher, averaging $3.73.
In the December STEO, EIA had pegged spot prices would average $3.27/MMBtu in 2017, a forecast that was 15 cents higher than predicted in November.
Prices in general increased through 2016 because of high gas use for electricity generation over the hot summer and because of declining production. Henry Hub averaged $3.59/MMBtu in December, when inventories fell below the five-year average. Last month also was the first time gas prices had averaged above $3.00 for a month since December 2014.
“Higher residential and commercial space heating demand during the first quarter of 2017 compared with a year earlier (which was very warm) is expected to keep prices above $3.50/MMBtu into April,” forecasters said. “With natural gas production also expected to be lower than year-ago levels in the first quarter of 2017, EIA expects inventory levels to be below the previous five-year average through much of the winter, putting upward pressure on natural gas prices. In 2018, upward price pressures are expected to continue, as both domestic consumption and exports growth are forecast to accelerate.”
Gas futures contracts for April 2017 delivery that were traded during the five-day period ending Jan. 5 averaged $3.38/MMBtu, according to EIA.
Dry gas production fell last year for the first time since 2005, averaging 72.4 Bcf/d in 2016, down 2.4% (1.8 Bcf/d) from 2015. However, expect that trend to reverse in 2017 and 2018.
“Dry natural gas production is forecast to increase in 2017 and 2018, rising by 1.4 Bcf/d (2.0%) and by 2.8 Bcf/d (3.8%), respectively,” according to the STEO.
“The return to increasing production reflects a forecast of higher Henry Hub natural gas spot prices as well as pipeline buildout, particularly in the Marcellus and Utica natural gas producing regions.”
Total U.S. gas consumption, which averaged 75.1 Bcf/d in 2016, also is forecast to increase, rising around 0.3 Bcf/d (0.4%) in 2017 and by 1.5 Bcf/d (2.0%) in 2018.
“In 2017, increases in total natural gas consumption are mainly because of higher residential and commercial consumption based on a forecast of colder winter temperatures,” EIA said. “In 2018, the electric power and industrial sectors are the main drivers of consumption growth.”
Based on forecasts by the National Oceanic and Atmospheric Administration, EIA is projecting heating degree days will be 6.7% higher in 2017 than in 2016, which had a warmer-than-normal winter. This year’s residential gas demand should increase by 6% year/year, with commercial gas consumption rising by 5.2%. In 2018, residential/commercial demand each are projected to be flat from 2017 levels.
“Forecast natural gas use in the electric power sector, which increased by 4.2% in 2016, falls by 4.4% in 2017 as rising natural gas prices contribute to increasing coal use for electricity generation,” the STEO said. “Forecast electric power sector consumption of natural gas increases by 2.7% in 2018 as overall electricity generation rises.”
In the industrial sector, gas demand increased by 1.9% in 2016, and it now is forecast to rise by 0.6% in 2017 and by 1.9% in 2018.
“New fertilizer and chemical projects contribute to industrial sector natural gas consumption growth,” EIA forecasters said. “A long period of low natural gas prices in the United States has made it economical for companies to upgrade existing ammonia plants and plan for the construction of new nitrogen projects, adding an estimated production capacity of 5.0 million tons per year through 2019.”
EIA expects gas pipeline exports to increase by almost 22% (1.0 Bcf/d) this year, mostly because of rising Mexico exports. Gross pipeline exports are expected to increase by 0.1 Bcf/d in 2017 and by 0.4 Bcf/d in 2018.
Liquefied natural gas (LNG) exports, which increased from almost zero in 2015 to an average of 0.5 Bcf/d in 2016, are seen averaging 1.4 Bcf/d in 2017 as the Sabine Pass LNG Project ramps up capacity by mid-year. In 2018, LNG exports are forecast to average 2.6 Bcf/d, driven by the expected start late this year of Cove Point LNG in Maryland, along with the ramp up at Cameron LNG and Freeport LNG on the Gulf Coast during the second half of 2018.
“With expected growth in gross exports, net imports of natural gas decline from 1.7 Bcf/d in 2016 to 0.7 Bcf/d in 2017,” according to EIA. “The United States is expected to become a net exporter of natural gas for the year in 2018, with net exports averaging 0.6 Bcf/d.”
While gas inventories reached a record high of 4,047 Bcf during mid-November, storage draws in recent weeks have been larger than normal, and inventories ended December below the previous five-year average for the first time since the end of April 2015, according to the STEO.
“Based on an assumption of relatively normal temperatures in the first quarter of 2017, EIA forecasts inventories to be 1,745 Bcf at the end of March, which would be 3.3% below the five-year average for that time of year. Inventories are expected to build at a pace that is slower than the five-year average from the end of March through October, bringing inventories to a projected 3,667 Bcf at the end of October, which is 5% below the previous five-year average for the end of October. In 2018, inventories are expected to largely follow the typical seasonal pattern.”
© 2024 Natural Gas Intelligence. All rights reserved.
ISSN © 1532-1231 | ISSN © 2577-9877 | ISSN © 1532-1266 |