E&P | Haynesville Shale | NGI All News Access | NGI The Weekly Gas Market Report
Haynesville Natural Gas Production Quietly Surging Behind Appalachia, Permian
Natural gas production from the stalwart Haynesville Shale has never recovered to the peaks of early 2012, but it remains a significant contributor to U.S. supply, the Energy Information Administration (EIA) said Friday.
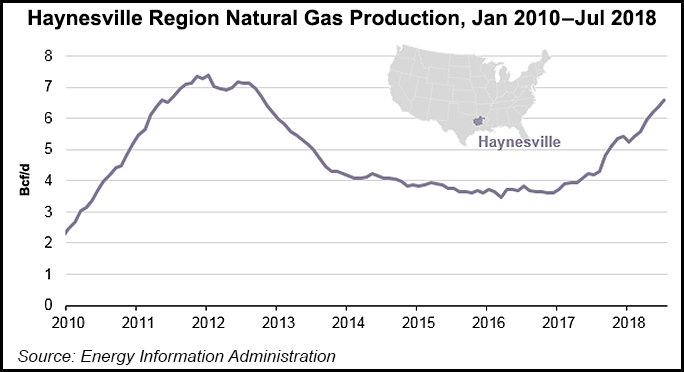
Output in June from the formation, which extends across parts of East Texas into southwestern Louisiana, averaged 6.4 Bcf/d, or about 8.5% of total U.S. dry gas production and the highest since September 2012, according to EIA research, which was compiled by principal contributor Naser Ameen.
Monthly production had peaked at 7.4 Bcf/d in January 2012 but had fallen to less than half that only about one year later. Last year the Haynesville remained the third largest producer of unconventional gas, which is led by Appalachia and the Permian Basin.
There’s beaucoup potential from the southern play, which makes it more costly to produce than the shallower Marcellus Shale, according to EIA. The Haynesville formation plunges to depths of 10,500-13,500 feet, while the Marcellus depth is 4,000-8,000 feet. Higher costs to produce mean the Haynesville is more dependent on the price of natural gas.
“In 2010, when the Henry Hub price averaged $4.50/MMBtu, 223 rigs were operating in the Haynesville,” Ameen said. “As the Henry Hub price dropped, the rig count followed, ultimately reaching a low of 20 rigs in operation in mid-2016.
“Since then, the Henry Hub price has increased, recently surpassing $2.00/MMBtu, and the Haynesville rig count has steadily increased to average at least 50 rigs operating in each month so far in 2018.”
Higher well productivity in the Haynesville, like in other plays, also has lifted production as lateral lengths and initial production rates have climbed. From 2010 to 2017, average lateral lengths per well increased to 6,241 feet from 4,269 feet, according to EIA calculations, based on DrillingInfo data.
Productivity Rate Improves
“The initial productivity rate in the Haynesville region, calculated as the initial three-month cumulative production per well, has nearly doubled from 2010 to 2017, increasing from 589 MMcf/well to 1,176 MMcf/well,” said Ameen’s research team. “Productivity gains are expected to continue as producers optimize natural gas recovery from the Haynesville formation.”
Undoubtedly, the “best outcomes” are when production rates are higher. Many Haynesville operators have gone back to older wells to refracture them, but so far, it’s been hit and miss.
GlobalData’s team highlighted 40 refractured wells by QEP Resources, which had produced “good performance, however, in many cases productivities were improved with respect to original rates. Indeed, a total of 22 wells recompleted by QEP…reached production rates of at least 1,700 boe/d, compared to their first IP rate of no more than 1,690 boe/d.”
Those slightly better rates may have persuaded QEP earlier this year to exit the Haynesville to become a Permian Basin pure-play.
By contrast, one of the original Haynesville operators, Chesapeake Energy Corp., began refracturing Haynesville wells a few years ago with some success and some retooled wells that were not so great. The Oklahoma City-based independent recompleted three wells in 2017 that had production rates that barely reached 1,000 boe/d, according to GlobalData. However, new wells that were recently turned inline showed production rates of about 1,740 boe/d.
“Repeated refracturing of horizontal wells has been much less implemented than vertical refracturing,” said GlobalData’s Adrian Lara, senior oil and gas analyst. “As a result, there is still a large variance in the results different operators obtain from horizontal well refracturing recompletions.”
The recompleted wells in Haynesville that achieved an improved recompletion rate have had a breakeven gas price of $2.54/Mcf and a net present value of $7.38 million, GlobalData researchers said.
More gas production from the Haynesville also could collide with escalating volumes from the north, according to BTU Analytics.
Appalachian Competition
In a blog post last month, Tony Scott said gas pipeline congestion has moved south as volumes from the Appalachia and Anadarko basins, along with Canada, are fighting for limited Midwest market access.
“The result of new pipeline capacity out of Appalachia has been a tightening in Dominion South basis in 2018, but the growth in outflows from the region has begun to weigh on downstream markets as well,” Scott said.
That extra supply growth from the Marcellus/Utica shales, Permian Basin and the stacked reservoirs in Oklahoma may put “further pressure on Carthage and Perryville pricing,” he said.
One gas pipeline solution being tested for support is by Midcoast Energy LLC, which in August unveiled CJ Express, a pipeline that could move 1-2 Bcf/d from Carthage to the Gulf Coast, helping East Texas and Cotton Valley operators get their production to markets.
With enough support, the 150-mile system, with pipe 36-42 inches in diameter, could be in service by mid-2020.
“The growing need for this project or another like it is highlighted by the growing divergence between Carthage pricing and Gulf Coast pricing (Katy and Henry Hub),” Scott noted. In the last two years, Carthage prices year-to-date in 2018 have weakened to a 13-cent discount to Henry Hub from an 8-cent discount in 2016.
“However, the trend has been an increasing discount, and more supply is expected to come from a combination of growth in the Haynesville and Cotton Valley, in addition to the impact of new pipeline capacity” from the Northeast, including Rover Pipeline and others, Scott said. Compared to the Katy market near Houston, he said, the spread is even wider, as demand growth has put upward pressure on Katy and Houston Ship Channel pricing.
In the next year or so, more export trains are likely at various LNG projects, adding more demand along the Gulf Coast. Said Scott, “While BTU Analytics expects there to be sufficient supply to meet this demand, new pipeline infrastructure to bridge the gaps will be critical.”
© 2024 Natural Gas Intelligence. All rights reserved.
ISSN © 2577-9877 | ISSN © 1532-1266 | ISSN © 2158-8023 |