Markets | NGI All News Access | NGI The Weekly Gas Market Report
NatGas Marketers Returned to Sales Decline in 2Q2014
BP plc had another strong quarter, extending its lead on the rest of the field, but most of the two-dozen leading natural gas marketers participating in NGI‘s 2Q2014 Top North American Gas Marketers Ranking reported decreases compared with 2Q2013.
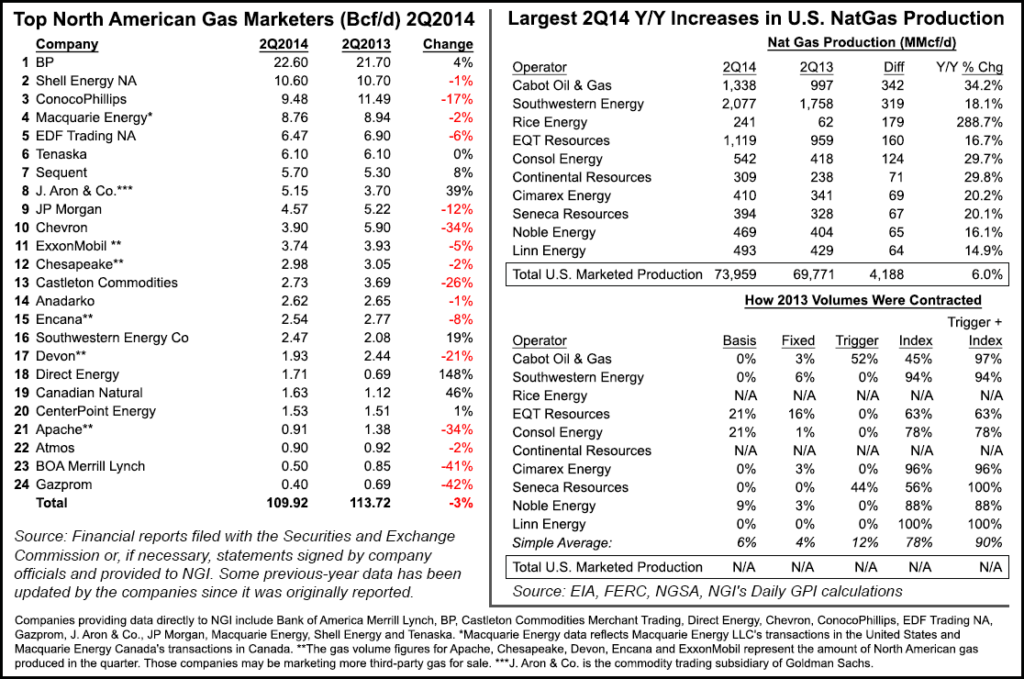
Twenty-four leading gas marketers reported combined sales transactions of 109.92 Bcf/d for 2Q2014, with six of the survey’s top 10 marketers and 16 companies overall reporting lower numbers than in 2Q2013. A year ago those same companies reported 113.72 Bcf/d in sales.
NGI‘s 1Q2014 survey had found a 0.5% increase compared with 1Q2013, a small rebound for a market that had been on a downward slope for nearly two years (see Daily GPI, June 12). NGI‘s survey of North American marketers hadn’t reported an overall increase in sales year/year since 2Q2012, when 27 participating companies sold a total of 135.86 Bcf/d. The 2Q2014 survey appears to confirm that the 1Q2014 results were an anomaly rather than a turning of the tide.
NGI‘s 2Q2014 marketer rankings were down year-over-year despite a comparable 6% year-over-year increase in U.S. marketed natural gas production from 69,771 MMcf/d during 2Q2013 to 73,959 MMcf/d during 2Q2014 (see chart), according to data compiled from the Energy Information Administration.
“There are likely three main reasons for this,” noted Patrick Rau, NGI director of strategy and research. “One is that a general lack of market volatility, at least when compared to previous years, is likely reducing the amount of traded volumes. Another is the general exit from commodities trading by investment banks has reduced the number of willing and able trading partners.
“But a third reason is that the growth in U.S. production is being led by independent producers, and many of those simply do not market much of their gas. Out of the 10 fastest growing U.S. natgas producers in terms of absolute (rather than percentage) production gains in the second quarter of 2014, only Southwestern Energy appears in the NGI survey.
“Moreover, those top 10 fastest production growing companies tend to sell 90% of their gas either off a published price index, or using some kind of a trigger mechanism to the Nymex screen, which is really just a form of an index deal itself,” Rau added. “Interestingly, none of the 2Q2014 top 10 fastest growing gas producers report deals to the published spot market index providers, another indication they may not actively market their own production.”
In the latest NGI survey, BP reported 22.60 Bcf/d, a 4% increase from 21.70 Bcf/d in 2Q2013. The London-based major plans to separate its U.S. onshore Lower 48 business (see Daily GPI, Aug. 20; March 4). The move is expected to help unlock the value associated with the company’s resource position in the U.S. Lower 48 onshore, which BP currently oversees through its Houston-based North America Gas group. At the same time, BP continues to deal with repercussions from its 2010 Macondo well blowout in the deepwater Gulf of Mexico (GOM) (see Daily GPI, Sept. 9; Sept. 4; Aug. 4).
Other Top 10 marketers reporting increases compared with 2Q2013 were Sequent (5.70 Bcf/d, up 8%) and J. Aron & Co. (5.15 Bcf/d, up 39%). Tenaska repeated its 6.10 Bcf/d performance from the year-ago period.
But the rest of the survey’s upper echelon didn’t fare so well in 2Q2014. Shell Energy NA reported 10.60 Bcf/d, down 1% compared with 2Q2013, and declines were also reported by Macquarie Energy (8.76 Bcf/d, down 2%), EDF Trading NA (6.47 Bcf/d, down 6%), JP Morgan (4.57 Bcf/d, down 12%) and Chevron (3.90 Bcf/d, down 34%).
The largest decline for the fifth consecutive month came at ConocoPhillips, which reported 9.48 Bcf/d, down 2.01 Bcf/d (17%) from 11.49 Bcf/d in 2Q2013. Such double-digit declines, which ConocoPhillips first reported in NGI‘s 1Q2013 survey, are primarily due to the implementation of business model restructuring in North America following the spin-off of downstream operations in 2012 (see Daily GPI, April 17, 2012) and the company’s view of market conditions. The plan appears to be paying off: ConocoPhillips is on track to achieve 3-5% volume and margin growth in 2014, and the Houston-based oil independent’s 2Q2014 production was up 6.5% compared with 2Q2013, although much of the gain was attributed to the company’s increasing emphasis on oil production (see Shale Daily, July 31). Its restructuring included the sale of some marketing assets and a reduced emphasis on trading (see Daily GPI, June 10, 2013).
There were only a handful of companies reporting increases compared with 2Q2013. Southwestern Energy Co. reported 2.47 Bcf/d, a 19% increase; Direct Energy reported 1.71 Bcf/d, more than doubling its 2Q2013 total of 0.69 Bcf/d; Canadian Natural reported 1.63 Bcf/d, a 46% increase, and CenterPoint Energy reported 1.53 Bcf/d, a 1% increase.
But losses outnumbered the gainers. ExxonMobil sales fell 5% compared with 2Q2013 to 3.74 Bcf/d, Castleton Commodities declined 26% to 2.73 Bcf/d, Devon was down 21% to 1.93 Bcf/d, and Apache fell 34% to 0.91 Bcf/d.
The effects of unusually cold temperatures during winter 2013-2014 continue to be seen in low natural gas storage numbers (see Daily GPI, Sept. 11) and price forecasts for 2015 have been dropping in recent days (see Daily GPI, Sept. 9). A good part of that is driven by the continuing surge of production coming out of the nation’s shale plays, but that may slow in the coming months, according to energy analyst Stephen Smith of Stephen Smith Energy Associates.
“There’s likely to be some slowdown in production growth in 2015, not because of rig counts but probably just because of the timing of various projects to expand the bottlenecks that had developed in the Marcellus,” Smith told NGI. “There’ll be some more of those projects coming on, but I think the timing is such that you probably will not see the same kind of growth. We’re looking at 5-6% growth in dry gas production year over year by the time 2014 is over. I’d be surprised if we saw another 6% growth rate next year.
“But even if the growth is 3%, it still keeps putting pressure on the supply-demand balance, because there’s simply not enough other growth. There will be some help coming down the road when some LNG [liquefied natural gas] export projects get underway in 2016, but they’re not there in 2015.”
The NGI survey ranks marketers on sales transactions only. Total combined natural gas purchase and sales volumes were 118,099 TBtu in 2013, down 4.7% from the prior year, according to an analysis by NGI of 2013 Form 552 buyer and seller filings from the Federal Energy Regulatory Commission (see Daily GPI, June 5). Purchase and sales volumes cannot be compared with production because a single package of gas may be sold several times between the wellhead and the burnertip.
© 2024 Natural Gas Intelligence. All rights reserved.
ISSN © 1532-1231 | ISSN © 2577-9877 | ISSN © 1532-1266 |