Marcellus | E&P | Eagle Ford Shale | NGI All News Access | NGI The Weekly Gas Market Report | Permian Basin | Utica Shale
Baker Hughes: Well, Rig Counts Both Increased in 2Q2014
The well count and rig count in the U.S. onshore both increased slightly during the second quarter of 2014. The former was boosted by strong gains in the Permian Basin, Marcellus Shale and Granite Wash formation, while the latter reflected a slight improvement in drilling efficiencies, Baker Hughes Inc. (BHI) said Friday.
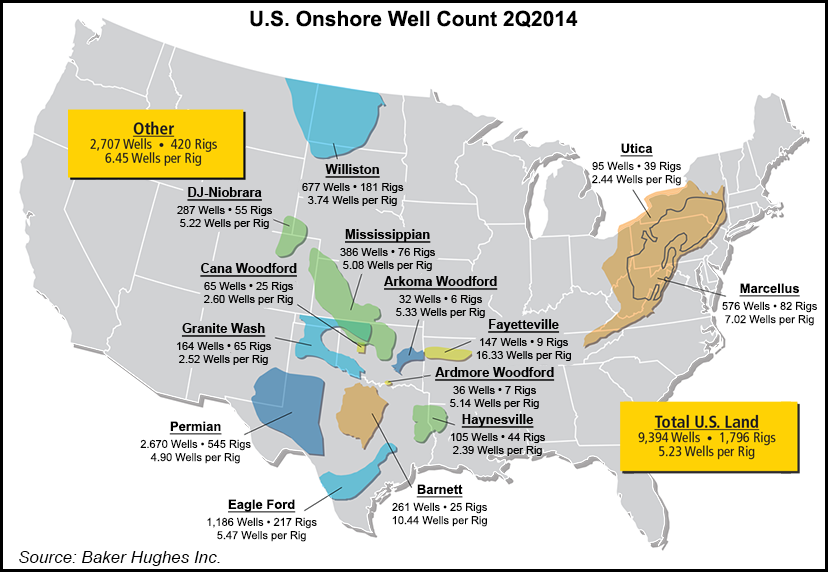
According to BHI, the onshore well count for 2Q2014 was 9,394 wells, a 5% increase (428 wells) over 1Q2014 and a 4% increase (383 wells) over 2Q2013. The year-to-date (YTD) well count total for 2014 stood at 18,360 wells, which is 4.6% higher (815 wells) above the YTD total from 2013.
For 2Q2014, the “Others” category — smaller drilling areas that do not geographically fall within a specific basin — led in the well count with 2,707 wells, but the Permian came in a close second at 2,670 wells. The Eagle Ford Shale was a distant third (1,186 wells), followed by the Williston Basin (677) and the Marcellus (576). YTD, the well count followed a similar pattern, with Others leading the list at 5,329 wells, followed closely by the Permian (5,075), then the Eagle Ford (2,364), Williston (1,358) and Marcellus (1,074).
Between the first and second quarters of 2014, the well count increased the most in the Permian, Marcellus and Granite Wash, climbing 11%, 16% and 23%, with 265, 78 and 31 additional wells, respectively. Gains in those three plays helped offset losses in the Barnett and Cana-Woodford shales, where well counts fell by 18% (57 wells) and 26% (23), respectively.
YTD, the Arkoma Woodford Shale is seeing the highest well count increase at 132%, but that was only for 58 wells total. The Permian and Eagle Ford were trending upward in the YTD totals — at 14.6% and 10.8%, respectively — but well counts were decreasing on a YTD basis in the Ardmore Woodford (down 33.3%), Barnett (31.6%), Fayetteville (21.4%) and Utica (19.3%) shales.
BHI said the average rig count for the U.S. onshore was 1,796 rigs during 2Q2014, a 4% increase (72 rigs) from 1Q2014, and a 5% increase (87 rigs) from the second quarter of 2013.
During 2Q2014, the Permian led in the number of rigs deployed with 545, followed by the Others category (420 rigs), the Eagle Ford (217) and the Williston (181). In terms of the YTD average, the Permian led in the rig count again at 518 rigs, followed by the Others category (409), the Eagle Ford (219) and the Williston (180). The YTD average for all onshore U.S. plays was 1,760 rigs, a 3.1% increase (53 rigs) over the same time frame in 2013.
According to BHI, the rig fleet deployed in the U.S. onshore produced 5.23 new wells per rig during 2Q2014, up slightly from 5.2 wells per rig in 1Q2014, but still lower than the second (5.27), third (5.31) and fourth (5.35) quarters of 2013. Nevertheless, YTD the rig fleet was producing 10.43 new wells per rig, a 1.5% increase (0.16 wells) over the same time frame in 2013.
© 2024 Natural Gas Intelligence. All rights reserved.
ISSN © 2577-9877 | ISSN © 1532-1266 | ISSN © 2158-8023 |