NGI Archives | NGI All News Access
Lower 48 Oil, NatGas Bounty Dominating Globe, Says BP
U.S. net oil imports last year fell to 6.5 million b/d, 47% below the 2005 peak, while net imports of natural gas dropped 13%, as exploration in the Lower 48 states delivered an energy bounty that eclipsed every other region in the world, BP plc economists said Monday.
Domestic oil production in 2013 saw the largest increase in history, with the United States producing 84% of its demand, up from an all-time low of 69% in 2005, according to BP’s Statistical Review of World Energy and Global Energy Outlook 2014. Group CEO Bob Dudley unveiled the report, published since 1952, at an energy conference in Moscow.
“The world of energy in 2013 echoed broader global themes, such as emerging differences in global economic performance, geopolitical uncertainty and ongoing debates about the proper roles of government and markets,” he said. “These are important issues, and ones over which opinions vary widely, and legitimately.
“It has been said that everyone is entitled to their own opinion, but not their own facts. And that is where the Statistical Review comes in…This first snapshot of the global energy picture in 2013…can help us to understand how the world around us is changing.”
U.S. energy production overall was 3.2% higher year/year, the largest increase in the world, according to BP. U.S. energy dominance is changing the trajectory of global markets in no small part because of the “amazing” growth in domestic oil and gas, said Group Chief Economist Christof Ruhl, who oversees the report.
The United States, where gas production was 1.3% higher than in 2012, remained the world’s leading producer, but Russia (2.4%) and China (9.5%) recorded larger growth increments in 2013, according to economists. Nigeria (minus 16.4%), India (minus 16.3%), and Norway (minus 5%) recorded the largest volumetric declines.
Energy production last year took a hit from geopolitical events, but the strong supply picture made merely a dent in what had once been volatile oil and gas prices. Despite the disruptions and heightened risks to supply, average oil prices were $100/bbl for the third consecutive year, higher than historically, but the price reflected reflected stable supplies brought on in growing numbers from the United States.
Dudley noted that the global picture is changing in no small part because the United States is no longer a bystander, but a full participant in global energy markets. Its dominance is coming at a particularly volatile time for the energy markets, with continuing turmoil in the energy-rich Middle East.
“Supply developments…highlighted the importance of our third topic, namely to get the balance right between policy and market forces,” said Dudley. “Driven by massive investment in shale and other tight formations, the U.S. saw the world’s largest increase in oil production last year, offsetting the numerous disruptions seen elsewhere and keeping prices stable.
“Indeed, the U.S. increase in 2013 was one of the biggest oil production increases the world has ever seen.”
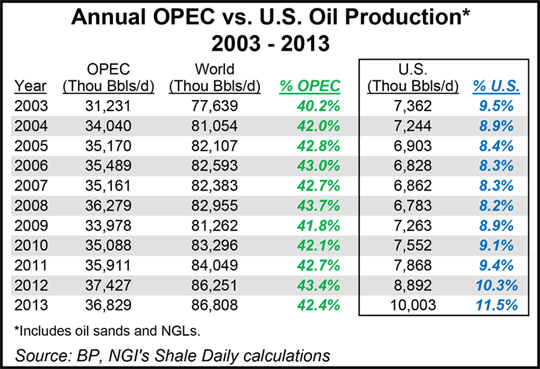
BP estimated that total North American oil production in 2013 was 16.826 million b/d, an 8.7% increase over 2012 and 18.9% of the total global output. U.S. oil production last year reached 10 million b/d, the highest level since 1986, with output growing by 1.1 million b/d, the largest increase in the world and in the country’s history.
The United States also was the third largest global oil producer last year. Canada production totaled 3.95 million bbl, 6% higher year/year and 4.7% of the total. Mexico’s output was 2.88 million bbl, a decline of 1.1% from 2012 and 3.4% of the worldwide output.
Gas-wise, total North American production last year was 86.986 Bcf/d, with 66.526 Bcf/d from the United States. Canada gas output last year contributed 14.98 Bcf/d, while Mexico added 5.48 Bcf/d. Worldwide, gas output last year was more than 328 Bcf/d, with production from OECD countries contributing more than 118 Bcf/d, while developing countries added almost 210 Bcf/d. The Former Soviet Union produced 75 Bcf/d-plus, while European Union output was more than 16 Bcf/d.
North America’s natural gas reserves/production (R/P) ratio was 13, with the United States at 13.6, Canada 13.1, and Mexico, 6.1. The R/P ratio is estimated by dividing the reserves remaining at the end of a year by the production in that year, which results in the length of time that those remaining reserves would last if production were to continue at that rate.
Global proven natural gas reserves at the end of 2013 totaled 6,557.8 Tcf, with North American reserves jumping to 413.7 Tcf, according to BP. The United States contributed 330 Tcf, or 5% of the world’s total. Canada’s proven gas reserves were estimated at 71.4 Tcf at the end of 2013, about 1.1% of the global total, with Mexico adding 12.3 Tcf (0.2%).
Domestic gas dominated as the top U.S. energy source for the third straight year, accounting for 33% of U.S. energy supply. Coal’s share (26%) of the U.S. market declined, while oil’s share rose to 23%. Alternative fuels accounted for 18% of domestic supply. Natural gas gained market share in every U.S. sector except power generation, noted BP’s economists. Regionally, energy consumption growth was below average everywhere but North America, as the petrochemical industry turned back to the United States and increased gas consumption.
The United States last year also continued to be the largest producer of biofuels (44%), nuclear (33%), renewables in power generation (21%) and natural gas (20%). Renewables in power have expanded every year since 2002 and accounted for a record 6% of U.S. generation. In addition to being the top producer, the United States was the largest consumer of global gas (22%) and oil (20%). Domestic energy consumption increased by 2.9% last year, accounting for 18% of the world’s total, but it was 4.5% below the 2007 peak. The decline is mostly because of improvements in energy efficiencies.
Oil (37%) remained the dominant fuel in the United States last year, followed by gas (30%), coal (20%), nuclear (8%), hydro (3%) and renewables (3%). Energy “intensity,” defined as the amount of energy required per unit of gross domestic product, increased by 1% after declining 5.4% in 2012. Growth was above the 10-year average of minus 1.9%.
“Production growth of renewables in power (16.2%), oil (13.5%), biofuels (4.6%), nuclear (2.8%) and natural gas (1.3%) outweighed declines in coal (minus 3.1%) and hydro (minus 2.3%),” said economists.
Despite all of the gains by natural gas and renewables, the country’s carbon dioxide emissions from energy use increased by an estimated 3% over 2012, according to BP. The United States also was the second largest contributor to global emissions growth in 2013.
© 2024 Natural Gas Intelligence. All rights reserved.
ISSN © 2577-9877 | ISSN © 2158-8023 |