NGI Archives | NGI All News Access | NGI The Weekly Gas Market Report
‘Proppant Intensity’ Rising in U.S. Onshore on Horizontal Drilling, Fracture Growth
Proppant consumption is increasing rapidly in the Anadarko and Denver-Julesburg basins, and the Bakken and Eagle Ford shales, as operators look to punch up reserves from horizontal well completions, PacWest Consulting Partners said in a new report.
In the latest ProppantIQ report, the Houston-based consultants said they expect the domestic land proppant market to grow overall by 10% from 2013 through 2015. More than 63,000 North American well records were used for the analysis.
The total number of horizontal wells drilled using hydraulic fractures (frack) is forecast to increase to 16,700 in 2015 from 11,300 in 2011, driving increased proppant consumption, the authors noted. “Horizontal wells consume more proppant per well, therefore are more relevant to proppant demand.”
More important, “the number of frack stages is expected to increase from 237,000 in 2011 to 389,000 in 2015.”
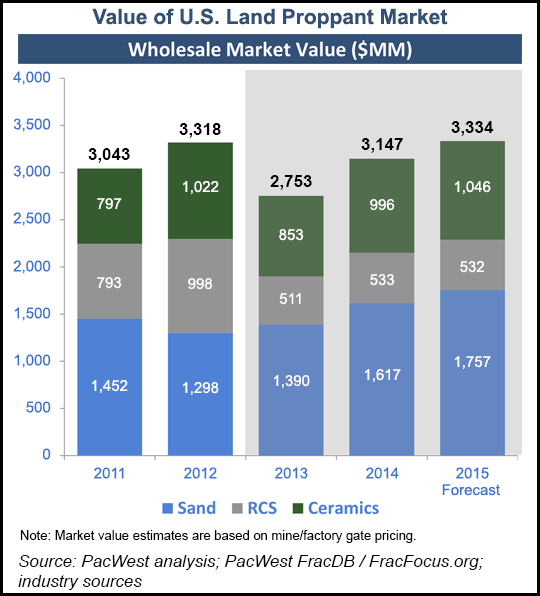
“We expect total U.S. land proppant consumption for well stimulation to increase from 51 billion pounds in 2011 to 83 billion pounds in 2015, equal to a 12.9% compound annual growth rate,” the authors said. The domestic market would increase over the period to $3.3 billion from $2.8 billion. Last October, PacWest reported that the U.S. proppant market would increase to 75 billion pounds by 2015 (see Shale Daily, Oct. 16, 2013).
“On a play-by-play basis, we forecast that the Eagle Ford, Appalachia, Bakken and Permian will account for 75% of proppant consumption in 2015.”
Between 3Q2012 and 3Q2013, aggregate U.S. proppant growth increased overall by 26%, led by the Appalachian (53%) and Permian (43%) basins, followed by the Bakken (35%) and Eagle Ford (17%) shales.
Proppant mass/well has increased in many U.S. plays, lifting “proppant intensity,” a key driver of demand. “The increase in average proppant mass/well is driven by increasing well sizes in the Appalachia, Bakken, Eagle Ford and Permian,” said the authors. Other plays have a “similar increasing trend,” but they are a smaller proportion of U.S. consumption.
Sand used to frack wells is forecast to account for two-thirds of the growth in market value, up 12% from 2013 to 2015. Premium ceramic proppants over the period should see 11% growth, followed by a 2% increase in resin-coated sand (RCS) demand.
Sand capacity is expected to increase by only 5%/year through 2015 because of an oversupply of finer grades and moratoria on new sand mines in most Wisconsin counties, noted PacWest researchers. RCS capacity shouldn’t increase through 2015 because of significant oversupplies and under-used existing coating facilities. “Robust completions” should mitigate the oversupply in the period.
However, ceramic capacity should increase by 2%/year, “as domestic manufacturers show some success in re-taking share from a glut of Chinese suppliers.” Ceramic prices are forecast to be stable over the next two years to offset price impacts on “low-end and high-end products.”
Houston’s Carbo Ceramics Inc., the biggest manufacturer of ceramics, is campaigning against Chinese imports, claiming they are inferior to domestic brands (see related story). The premium proppant manufacturer reported a 29% increase in its 2013 North American sales.
“Ceramic consumption has grown by over 40% since 2011,” noted PacWest consultants. However, in the forecast period 2013-2015, sand still will account for most of the growth. White sand pricing is seen increasing by 3% through 2015 because of a tight coarse grade sand market, while brown sand pricing should remain stable. RCS pricing, noted the report, “has consistently decreased since 2011” and should continue to fall, while ceramic prices are forecast to decline by 1%.
For the report, PacWest researchers used their proprietary FracDB database, as well as public records on FracFocus.org and Canada’s FracFocus.ca. PacWest’s WellIQ also was used, offering an analysis of wells that were fracked, by well trajectory and play.
© 2024 Natural Gas Intelligence. All rights reserved.
ISSN © 2577-9877 | ISSN © 1532-1266 | ISSN © 2158-8023 |