Markets | NGI All News Access | NGI The Weekly Gas Market Report
EIA: Domestic Consumption, Exports Up as Foreign Dependency Declines
Abundant supply and low prices will drive consumption of natural gas in the industrial and electric power sectors to new levels in 2040 as exports of U.S. gas via pipeline and in liquefied form grow as well, according to the U.S. Energy Information Administration’s (EIA) Annual Energy Outlook 2014 (AEO2014) early release.
A higher level of industrial shipments will lead to more natural gas consumption (including lease and plant fuel) in the U.S. industrial sector, increasing from 8.7 quadrillion Btu in 2012 to 10.6 quadrillion Btu in 2025 in AEO2014, compared to 9.8 quadrillion Btu in 2025 in AEO2013.
According to EIA, industrial shipments grow at a 3.0% annual rate over the first 10 years of the projection and then slow to 1.6% annual growth for the rest of the projection. Bulk chemicals and metals-based durables account for much of the increased growth in AEO2014. Industrial shipments of bulk chemicals, which benefit from an increased supply of natural gas liquids, grow by 3.4% per year from 2012 to 2025 in AEO2014, as compared with 1.9% in the AEO2013 reference case. The projection assumes growing competition from abroad that flattens output growth in energy-intensive industries after 2030.
“The EIA report confirms that the United States really is experiencing an energy revolution. Once again, a combination of price, technology and new areas has pushed away fears of shortage. And it’s not over. Technologies will continue to advance capabilities and widen opportunities,” according to IHS Vice Chairman Daniel Yergin, who wrote The Quest: Energy, Security, and the Remaking of the Modern World.
“This is not only about energy, but also is proving a big boost to the U.S. economy at a time when it really needs a boost. This also underlines even more the question of when and how this revolution goes global. Around the world — from China to the Middle East to Europe to Mexico — this surge from the United States has become a top focus of energy discussion and also a new factor in geopolitics.”
Standard & Poor’s Ratings Services (S&P) published a note last week on the shale revolution in which one analyst warned that the shale patch will need more qualified workers to keep the boom going while he marveled at what all the cheap gas has meant for U.S. industrial development.
“It’s striking how much industrial development the [shale] revolution has spurred in the U.S.,” said S&P’s John Kingston. “Industries that had left the country a long time ago are returning. I think of direct reduced iron, a steel-making feedstock [see Daily GPI, Nov. 8]. A couple of plants are back in the U.S. There’s also a big pipe and tube plant in Youngstown, OH [see Daily GPI, Jan. 12, 2012], to serve the Marcellus Shale. And Dow Chemical Co. has announced that it is making some big chemical expansions [see Daily GPI, March 19]. None of this would have happened without the natural gas price advantage that the U.S. has over its international competition.”
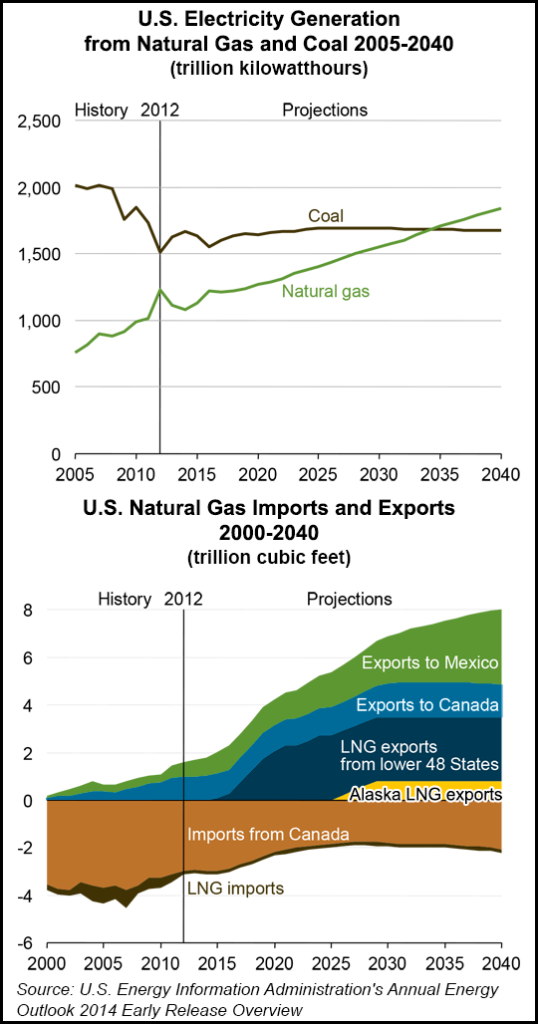
At home in the United States, natural gas will overtake coal in market share for power generation, EIA said. “In 2040, natural gas accounts for 35% of total electricity generation, while coal accounts for 32%,” AEO2014 said. “Generation from renewable fuels, unlike coal and nuclear power, is higher in the AEO2014 reference case than in AEO2013.”
Along with domestic consumption of gas, exports also will grow over the period, according to the outlook’s reference case. U.S. exports of liquefied natural gas increase to 3.5 Tcf in 2029 and remain at that level through 2040. Pipeline exports of U.S. gas to Mexico grow by 6% per year, from 0.6 Tcf in 2012 to 3.1 Tcf in 2040, and pipeline exports to Canada grow by 1.2% per year, from 1.0 Tcf in 2012 to 1.4 Tcf in 2040.
Over the same period, U.S. pipeline imports of gas from Canada fall by 30%, from 3.0 Tcf in 2012 to 2.1 Tcf in 2040, as more U.S. demand is met by domestic production, EIA said.
Domestic production of crude oil (including lease condensate) increases sharply in the AEO2014 reference case, with annual growth averaging 0.8 million b/d through 2016, when it totals 9.5 million b/d, not far from the historical high of 9.6 million b/d seen in 1970. While domestic crude oil production is expected to level off and then slowly decline after 2020 in the reference case, natural gas production grows steadily, with a 56% increase between 2012 and 2040, when production reaches 37.6 Tcf).
The supply growth of domestic crude oil and gas will drive down the country’s reliance on energy imports over the period.
In the AEO2014 reference case, U.S. domestic energy production increases from 79.1 quadrillion Btu in 2012 to 102.1 quadrillion Btu in 2040, and net use of imported energy sources, which was 30% in 2005, falls from 16% of total consumption in 2012 to 4% in 2040. In the AEO2013 reference case, domestic energy production reached a total of 98.5 quadrillion Btu, and energy imports are projected to decline as a percentage of consumption to 9% in 2040.
The larger increase in domestic energy production in the latest outlook is primarily a result of higher projections of production of natural gas and biomass/other renewables. Crude oil production (including lease condensate) increases from 13.9 quadrillion Btu in 2012 to a peak of 20.5 quadrillion Btu in 2019 before dropping to 16.0 quadrillion Btu in 2040.
With domestic crude oil production rising to 9.5 million b/d in 2016, the import share of U.S. petroleum and other liquids supply falls to about 25%. Domestic production begins to decline after 2019, and the import share of total petroleum and other liquids supply grows to 32% in 2040, still lower than the 2040 level of 37% in the AEO2013 reference case.
Meanwhile, increased use of natural gas in power plants — along with residential and transportation sector efficiency gains — will contribute to U.S. energy-related carbon dioxide emissions staying below their 2005 level through 2040, according to EIA.
© 2024 Natural Gas Intelligence. All rights reserved.
ISSN © 1532-1231 | ISSN © 2577-9877 | ISSN © 1532-1266 |