NGI The Weekly Gas Market Report
NGI Archives | NGI All News Access
EIA Bumps 2014 Henry Hub Estimate to $4.00/MMBtu
The Henry Hub spot price for natural gas is expected to increase to $4.00/MMBtu next year, compared with an estimated $3.71/MMBtu this year and an average $2.75/MMBtu in 2012, according to the U.S. Energy Information Administration (EIA). Those projections are both higher than EIA had expected last month, when it estimated 2013 to be $3.68/MMBtu and 2014 to be $3.91/MMBtu (seeNGI, Sept. 16).
Henry Hub spot prices averaged $3.62/MMBtu in September, up 19 cents from August, EIA said in its Short-Term Energy and Winter Fuels Outlook, which was released last week. “While prices declined from April through August, they began increasing last month in anticipation of winter heating demand,” said the agency.
Gas futures prices for January 2014 delivery (for the five-day period ending Oct. 3) averaged $3.83/MMBtu. Current options and futures prices imply that market participants place the lower and upper bounds for the 95% confidence interval for January 2014 contracts at $2.91/MMBtu and $5.04/MMBtu, respectively. At this time one year ago, the gas futures contract for January 2013 averaged $3.84/MMBtu, and the corresponding lower and upper limits of the 95% confidence interval were $2.77/MMBtu and $5.31/MMBtu, EIA said.
Some analysts, citing the impact on prices of robust production out of the Marcellus Shale, have recently trimmed their price forecasts for 2013 and beyond (see related story; NGI, Aug. 26). Bank of America analysts “see downside risk” to its 2014 price forecast of $4.20/MMBtu, while Bernstein Research analysts said they expect Henry Hub prices to average $4.00/Mcf gas price in 2014 and 2015, though Marcellus resource estimates could continue to increase.
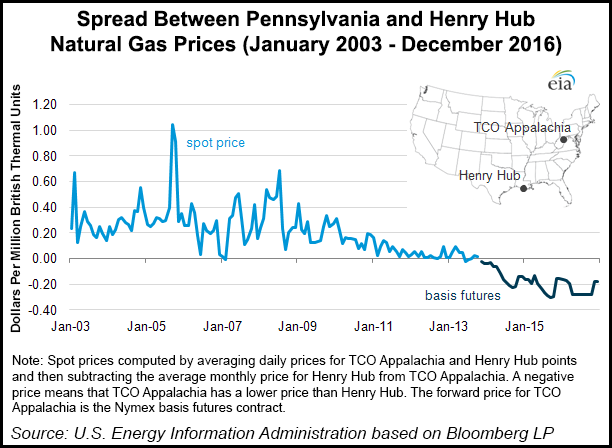
With the natural gas production boom out of the Utica and Marcellus shales of Pennsylvania, West Virginia and Ohio continuing to lower prices of the commodity in the region, EIA analysts believe by early next year the price of southwestern Pennsylvania natural gas at the TCO Appalachia trading point (NGI‘s Columbia Gas index) will more regularly fall below the benchmark Henry Hub located in Erath, LA.
“Natural gas prices in the Mid-Atlantic have traditionally been more expensive than Henry Hub, reflecting the cost of moving natural gas from the production in the Gulf region to consumers along the East Coast,” EIA said last week. “Increased production from the Marcellus region began changing that relationship in 2011.”
According to EIA data, natural gas production in the Northeast has grown by about 3.2 Bcf/d so far in 2013, a 30% increase from the same period last year. Total natural gas production in the region reached 12.2 Bcf/d in August, a 4.1-Bcf/d increase from August 2012 and a 2.5-Bcf/d increase from the end of last year.
Production in West Virginia reached 2.4 Bcf/d in August, which is 0.8 Bcf/d above the August 2012 level, with 0.6 Bcf/d of that growth occurring in 2013, EIA data show. The liquids-rich areas of the state experienced the most growth as a result of the beginning of operations at two new natural gas processing facilities — the Mobley (Wetzel County, WV) and Natrium (Marshall County, WV) — and the expansion of several existing plants.
The EIA said the Pennsylvania growth is coming mostly from dry gas production in the northeastern portion of the state, which coincides with infrastructure improvements in the region, as gathering lines and pipeline capacity expansions have helped flow more gas to market. However, capacity constraints still plague Marcellus production in northeastern Pennsylvania, which has put downward pressure on associated prices. NGI Shale Daily’s Shale Price Indices show a significant gap in prices between the two major production zones of the Marcellus. For gas traded last Tuesday for Wednesday delivery, NGI’s Marcellus Northeast-PA index averaged $2.33/MMBtu, while NGI’s Marcellus Southwest-PA/WV index came in with an average of $3.54/MMBtu. NGI‘s Henry hub index on the day averaged $3.71/MMBtu.
NGI Director of Strategy and Research Patrick Rau noted that the Marcellus in Pennsylvania is so large that if it were in two different states, it may very well be considered to be two different basins due to well economics and pipeline infrastructure.
“Gas in some portions of southwest Pennsylvania is more liquids rich, so that obviously gives a boost to the economics,” Rau said. “But what hasn’t been as obvious is the fact that the southwest portion of Pennsylvania has been served by pipelines that were designed to handle both receipts and deliveries in the same general area. There was already legacy, more conventional production in southwest Pennsylvania, so pipelines like Dominion Transmission and Columbia Gas (TCO) were in a much better position to absorb the surge in Marcellus production.”
However, Rau pointed out that northeastern Pennsylvania was a little less prepared. “The two main pipelines in the northeastern Marcellus, which are Tennessee and Transco, were built to transport gas from the Gulf Coast to areas farther downstream, such as New England and New York,” he said. “It just so happens that they pass through counties that are now flush with Marcellus production.
“Those lines weren’t really built to receive full scale receipts in northeast Pennsylvania, and that has led to major capacity constraints there, which in turn has created massive negative basis differentials relative to both the Henry Hub and to pipelines in the southwest part of the state. But those southwest Pennsylvania pipelines are becoming more constrained themselves, and we are starting to see negative basis differentials there as well.”
The EIA added that the forward curve for TCO Appalachia was also negative relative to Henry Hub in the middle of 2012, but unusually cold winter weather in late 2012 and early 2013 changed the dynamic in the spot market.
Nationwide esidential use of natural gas, which is the sector most sensitive to weather impacts, was 3,470 Bcf last winter, according to EIA data. That was up significantly from 2,989 Bcf in 2011-2012, the low point for residential consumption over the past five years. U.S. residential natural gas consumption during winter months has averaged 3,410 Bcf since 2008-2009.
Colder winter temperatures this year, compared with record-warm temperatures last year, are expected to increase the amount of natural gas used for residential and commercial space heating, but projected year-over-year increases in gas prices will contribute to declines in gas used for electric power generation, from 25.0 Bcf/d in 2012 to 22.1 Bcf/d this year and 21.6 Bcf/d in 2014, EIA said. Total natural gas consumption, which averaged 69.7 Bcf/d in 2012, will average 70.0 Bcf/d and 69.4 Bcf/d in 2013 and 2014, respectively, the agency said.
Weather Services International (WSI) has said it expects temperatures nationally to average cooler than normal from the Northern Plains into the Ohio Valley over the next three months, with above-normal temperatures elsewhere, particularly across portions of Texas and the Southwest (see NGI,Sept. 30). And an early look at indicators suggests that later winter months may be characterized by more widespread cold, WSI said. Forecasters at the Farmers’ Almanac have said they expect the upcoming winter will be colder than normal for most of the United States (see NGI, Sept. 2).
There was 3,577 Bcf of natural gas in storage for the week ending Oct. 4, 138 Bcf less than a year earlier but 55 Bcf more than the five-year average, according to the latest EIA Weekly Gas Storage Report.
“Under the baseline winter weather scenario, EIA expects end-of-October working gas inventories will total 3,830 Bcf and end March 2014 at 1,890 Bcf,” the agency said. “The projected 1,940 Bcf inventory drawdown during this winter is similar to the previous five-winters (October 2008-March 2013) average of 1,940 Bcf. Because storage withdrawals are primarily used to meet winter heating demand, changes in weather can significantly alter winter drawdowns.
“This year’s Winter Fuels Outlook projects a drawdown of 2,340 Bcf in the cold-winter scenario (heating degree days 10% higher than projected) and 1,560 Bcf in the warm-winter scenario (10% fewer heating degree days). In the cold-winter scenario, storage inventories exit the heating season with a projected 1,450 Bcf at the end of March.” The cold-winter scenario ending stock level would be higher than the average 1,271 Bcf between 2000 and 2009, reflecting increases in storage capacity and production over the last few years, EIA said. Production from the eastern United States, including the powerhouse Marcellus Shale, will help make the country the world’s top producer of natural gas this year, EIA said recently (see NGI, Oct. 7b).
Natural gas marketed production is projected to increase from 69.2 Bcf/d in 2012 to 70.0 Bcf/d in 2013 and to 70.4 Bcf/d in 2014. Natural gas pipeline gross imports, which have fallen over the past five years, are projected to fall by 0.3 Bcf/d in 2013 and then remain near 2013 levels in 2014. Liquefied natural gas imports are expected to remain at minimal levels of about 0.4 Bcf/d through 2014.
EIA and the National Association of State Energy Officials last week postponed the 2013-2014 Winter Fuels Outlook Conference, which had been set for Tuesday, rescheduling the conference to Nov. 1. EIA offices also closed at the end of business Friday because of the government shutdown (see related story).
© 2024 Natural Gas Intelligence. All rights reserved.
ISSN © 2577-9877 | ISSN © 1532-1266 |