NGI Archives | NGI All News Access
Rough Ride in 2Q for North America’s Natural Gas Marketers
U.S. natural gas marketers were in the midst of a full tactical retreat in the second quarter, with only seven of 24 companies reporting higher numbers compared with the same quarter last year, resulting in an 11% (14.82 Bcf/d) overall decline in gas sales transactions in 2Q2013 compared with 2Q2012, according to NGI‘s 2Q2013 Top North American Gas Marketers Ranking.
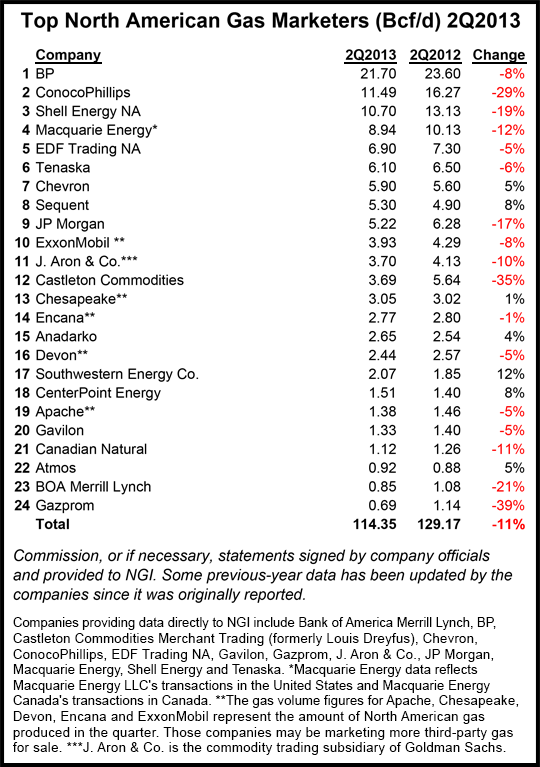
Twenty-four leading gas marketers reported combined sales transactions of 114.35 Bcf for 2Q2013, with eight of the survey’s top 10 marketers and 17 companies overall reporting lower numbers than in 2Q2012.
It was the third consecutive NGI survey to find a decline in natural gas sales compared to the year-ago period (see Daily GPI, June 10; March 21).
The falloff in marketed gas is somewhat surprising because average temperatures across the country during the quarter, and particularly in April, would indicate a stronger market, according to energy analyst Stephen Smith of Stephen Smith Energy Associates.
“The strip trended up until about April 19 and it peaked at over $4.50, and then it trended lower, and it bottomed out in August,” Smith told NGI. “It’s very, very rare to see a strip or a price peak in April. What happened was the winter had two parts to it; the winter had a warm part which was up until Feb. 15, and between Feb. 15 and the end of April it was unusually cold. In fact it was cold enough so that a great big 500 Bcf storage above normal level got reduced to zero in that period.” And that cool spring was followed by below-normal average temperatures this summer.
Low gas prices have had an impact over the past two years, stimulating gas demand, which, in turn, has trimmed the storage surplus. And production has been basically flat for about 18 months.
“The shale boom has slowed,” Smith said. “That’s because the market couldn’t accommodate it…The only thing that’s still growing is the Marcellus.”
The survey’s largest marketers were not spared when it came to volume declines.
BP plc reported 21.70 Bcf/d in 2Q2013, enough to place it again at the top of the survey by a large margin, but a 1.90 Bcf/d (8%) decline compared with 2Q2012. The company recently sued the U.S. government to overturn a suspension from federal contracts for most of its entities, including the exploration and production (E&P) arm, imposed by the U.S. Environmental Protection Agency last November because of its “lack of business integrity as demonstrated by the company’s contact with regard to the Deepwater Horizon blowout, explosion, oil spill and response…” (see Daily GPI, Aug. 19; Nov. 29, 2012). EPA disqualified the E&P arm from federal contracts in February and it was conspicuously absent from the Bureau of Ocean Energy Management’s recent Western Gulf of Mexico Lease Sale 233 (see Daily GPI, Aug. 29).
For the second consecutive quarter, the biggest decline in volume came at ConocoPhillips, which reported 11.49 Bcf/d, down 4.78 Bcf/d (29%) compared with 16.27 Bcf/d in 2Q2012. The difference again is primarily due to the implementation of business model restructuring in North America following the spin-off of the company’s downstream operations last year (see Daily GPI, April 17, 2012) and its view of current market conditions. In implementing its plan, the super independent expects less volume associated with outright trading, and less volume in noncore areas. ConocoPhillips began 2012 with the sale of its Midwest commercial and industrial natural gas portfolio to EDF Trading (see Daily GPI, Jan. 11).
Shell Energy NA saw its 2Q2013 decline to 10.70 Bcf/d, down 19% from 13.13 Bcf/d in 2Q2012. Shell took a $2 billion charge in 2Q2013 that primarily related to the value of U.S. and Canadian liquids-rich properties, and a review of North American assets may lead to selling as much as half of the company’s main nine unconventional natural gas and oil assets (see Daily GPI, Aug. 2).
Other top 10 companies reporting declines in 2Q2013 compared with 2Q2012 were Macquarie Energy (8.94 Bcf/d, down from 10.13 Bcf/d), EDF Trading (6.90 Bcf/d, down from 7.30 Bcf/d), Tenaska (6.10 Bcf/d, down from 6.50 Bcf/d), JP Morgan (5.22 Bcf/d, down from 6.28 Bcf/d) and ExxonMobil Corp. (3.93 Bcf/d, down from 4.29 Bcf/d).
Chevron Corp. (5.90 Bcf/d, up from 5.60 Bcf/d) and Sequent Energy Management (5.30 Bcf/d, up from 4.90 Bcf/d) were the only companies in the survey’s top 10 to report increases.
Highlights of NGI‘s 2Q2013 Top North American Gas Marketers Ranking include a 1% increase for Chesapeake Energy Corp. (3.05 Bcf/d, compared with 3.02 Bcf/d in 2Q2012), a 4% increase for Anadarko Petroleum Corp. (2.65 Bcf/d, compared with 2.54 Bcf/d in 2Q2012), a 12% increase for Southwestern Energy Co. (2.07 Bcf/d, compared with 1.85 Bcf/d in 2Q2012), a 2% increase for CenterPoint Energy (1.51 Bcf/d, compared with 1.40 Bcf/d in 2Q2012) and a 5% increase for Gavilon Group LLC (0.92 Bcf/d, compared with 0.88 Bcf/d in 2Q2012).
But declines outweighed those increases. Castleton Commodities reported a 35% decline; J. Aron & Co. a 10% decline; Devon Energy Corp. a 5% decline; and Encana Corp. a 1% decline.
Not appearing in the NGI survey for the first time since 1Q2001 is Oneok Inc., which shut down its natural gas marketing business in June in a nod to the reality of flattened basis spreads and the more challenging gas trading environment (see Daily GPI, June 13). Citigroup, which joined the survey in4Q2009, declined to report for 2Q2013, a business decision the company said was “based on the current regulatory environment.”
And there could be more changes on the way. JP Morgan has said it is planning to exit the physical commodities business, including its remaining commodities assets holdings and its physical trading operations (see Daily GPI, July 29). Japan’s Marubeni Corp. announced in early July that it paid about $2.7 billion to acquire all of Gavilon’s assets, except the Omaha-based company’s energy business.
The marketers survey ranks sales transactions only. Total combined natural gas purchase and sales volumes were 123,868 TBtu (Bcf) in 2012, a 0.7% decline compared with 124,752 TBtu in 2011, according to a recent analysis by NGI of 2012 Form 552 buyer and seller filings with the Federal Energy Regulatory Commission (see Daily GPI, June 4). Purchase and sales volumes cannot be compared with production because a single package of gas may be sold several times between the wellhead and the market.
© 2024 Natural Gas Intelligence. All rights reserved.
ISSN © 1532-1231 | ISSN © 2577-9877 |
