Not So Hot September Sends Natural Gas Forward Curves Lower, Except in Permian
Last week, it was record natural gas production. This week, it’s weather forecasts that turned markedly cooler for September, sending October natural gas forward prices down an average 6 cents from Aug. 30-Sept. 5, according to NGI’s Forward Look.
The latest weather outlooks, which just last week showed intense summer heat lasting well into September, show national demand waning during the next several days as showers and cooler temperatures impacted large stretches of the east-central and southern United States, aided by a cool front feeding off remnants of former tropical system Gordon. It was expected to remain hot over the East Coast on Thursday, with highs forecast to climb into the upper 80s to 90s before cooling arrived Friday, according to NatGasWeather.
“With highs mainly in the 80s over the southern United States and with only limited coverage of 90s, national demand will ease to much lighter levels Friday through early next week,” the forecaster said.
There are areas of the West that are expected to remain hot with highs forecast in the 90s to 100s, especially over interior California and the Southwest, NatGasWeather said.
High pressure is expected then to return across much of the country later next week for a swing to slightly stronger demand, “although coverage of 90s will still be primarily confined to only portions of the southern U.S. and West,” it said.
The forecaster sees the potential for the first decent cool shots of the fall season into the Midwest and East beginning around Sept. 20, “but with more to prove.” Also of interest, Hurricane Florence over the central Atlantic Ocean is expected to approach the United States late next week and “will need close watching as it could approach as a very strong cyclone.”
Most important, however, summer heat is expected to rapidly fizzle after Sept. 16-17, with weather patterns quickly becoming neutral to bearish. This sets the stage for much larger weekly storage builds to come in the weeks ahead given the recent record production growth, according to the forecaster.
To its view, upcoming storage builds “better not disappoint or bears could be forced to cover,” it said.
The Energy Information Administration (EIA) reported a 63 Bcf injection into Lower 48 gas inventories for the week ending Aug. 31, a print that fell within the range of expectations.
“After a couple weeks of missing back and forth between opposite sides, this print confirms our strong reading of balance over the past month, and indicates a sizable loosening in the market over the last few weeks,” Bespoke Weather Services said.
The firm said additional loosening in the market could see inventories reach 3.4 Tcf, which it has projected for the end of the traditional injection season.
The 63 Bcf reported injection compares to a five-year average 65 Bcf build and a 60 Bcf build recorded in the year-ago period. Total working gas in underground storage as of Aug. 31 stood at 2,568 Bcf, 590 Bcf below the five-year average and 643 Bcf lower than year-ago levels, according to EIA.
By region, the South Central posted a net withdrawal for the week, thanks to 5 Bcf pulled from salt, offsetting 4 Bcf injected into nonsalt. The Midwest posted the largest net injection at 32 Bcf, followed by the East, which saw a build of 22 Bcf. The Mountain and Pacific regions each injected 5 Bcf, according to EIA.
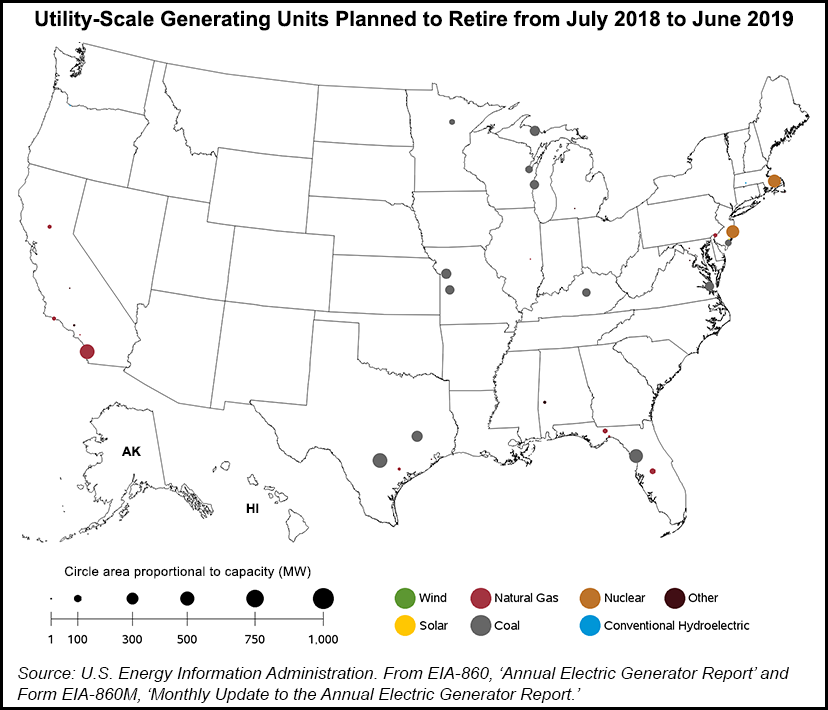
Still, with hefty storage deficits remaining, market observers appear to be taking notice of demand. Some pointed to the substantial retirements of coal generation capacity over the last year. IAF Advisors’ Kyle Cooper said that about 17,000 MW of coal capacity went off the grid from June 2017 to June 2018. Genscape Inc. natural gas analyst Eric Fell also acknowledged the loss of coal in the power generation stack, although he said the next 12 months should garner a much slower pace of retirements.
Despite the lagging injections so far in the season, Jefferies analysts believe that the storage deficit can be reduced this winter given production’s recent growth trajectory.
U.S. natural gas production in August averaged 81.9 Bcf/d, up 1.3 Bcf/d sequentially and 9.5 Bcf/d higher year/year, according to Jefferies LLC analysts. Growth has continued into September, with production averaging just above 83 Bcf/d for the first six days of the month.
“Production has increased significantly this summer, driven by gas-focused plays, with the Marcellus plus 1.8 Bcf/d since May and Haynesville plus 0.7 Bcf/d,” analysts said.
While associated gas production has also increased, the summer growth has been more modest, it said. Permian Basin volumes are up just 0.3 Bcf/d (likely beginning to be impacted by infrastructure constraints) and Eagle Ford Shale and Denver-Julesburg Basin volumes are largely flat.
On the demand side, U.S. natural gas demand averaged 79.2 Bcf/d in August, up 6.3 Bcf/d year/year, according to Jefferies. The growth in demand was driven largely by power demand (3.6 Bcf/d higher year/year), liquefied natural gas (LNG) (up 1.5 Bcf/d), Mexican exports (up 0.7 Bcf/d) and industrial demand (increasing 0.6 Bcf/d).
Power demand has averaged 3.5 Bcf/d higher year/year through the summer, a result of both warmer weather and a shift in baseload demand, according to Jefferies. LNG demand should continue to ramp in early 2019, as Cheniere Energy Inc.’s “Sabine Pass Train 5 has applied to begin receiving feed gas and the in-service date was just pulled forward to 1Q2019. Additionally, the company’s initial Corpus Christi LNG Train is also scheduled for in-service in the first half of 2019, Jefferies analysts said.
With only eight weeks remaining in the refill season, the investment bank expects inventories to enter November at around 3.4 Tcf, 9% below average. Assuming five-year average winter withdrawals, it estimated that production would need to average roughly 7.0 Bcf/d higher year/year for storage to reach the five-year average (around 1.7 Tcf) by the end of March.
“This level of production would imply a winter average of just 83.3 Bcf/d, just 1.4 Bcf/d higher than the August average and roughly in line with the new recent daily high,” analysts said.
Given the fundamentals at play, the Jefferies team continues to see little upside in near-term gas prices.
On the other hand, NatGasWeather said it didn’t see prices going too much lower “until record production proves it’s a force to be reckoned with, which it’s failed miserably in proving the past three months.”
Most Pricing Hubs Follow Nymex Lower
It was largely a sea of red for October forward prices as much of the country followed the lead of Nymex futures. The October futures contract slid 7.9 cents from Aug. 30-Sept. 5 to reach $2.795. After Thursday’s EIA report, the prompt month lost another 2.3 cents to settle at $2.772.
It’s no surprise that some of the steepest declines occurred in the Northeast, which has been hit with unrelenting heat for much of the summer. But with weather outlooks showing easing temperatures in the days and weeks to come, there was no other direction for prices to move.
Algonquin Citygate October prices tumbled 14 cents to $3.015, while November fell 11 cents to $3.463 and the winter 2018-2019 dropped 7 cents to $7.74. Very similar weakness was seen across the Tennessee zone 6 200L forward curve, although other Northeast points posted more modest losses that were in line with the Nymex futures curve, Forward Look data show.
In Appalachia, Dominion South October prices slipped 7 cents from Aug. 30-Sept. 5 to reach $2.39, while November fell 8 cents to $2.453 and the winter 2018-2019 slid 7 cents to $2.54. Transco Leidy, Tennessee zone 4 Marcellus and other regional pricing hubs posted similar losses.
In the West, SoCal City-gate October plunged 33 cents from Aug. 30-Sept. 5 to reach $3.038, and November dropped 30 cents to hit $3.163. The winter 2018-2019 was down 20 cents to $4.18.
The Permian Basin, however, saw forward curves move against the pack, with the prompt month posting the largest increases because of recent strength in cash trading. Waha October jumped 14 cents to $1.376, while November edged up just 6 cents to $1.49 and the winter 2018-2019 rose 7 cents to $1.36. El Paso-Permian October climbed 6 cents to $1.381, November tacked on a penny to hit $1.386, but the winter 2019-2019 slipped as much to $1.51, according to Forward Look.
The increases come amid back-to-back increases in the two days of trading since the Labor Day holiday. After jumping 55 cents on Tuesday, Waha spot gas tacked on another 18 cents Wednesday to average $2.02, closing the gap on Henry Hub (which fell to $2.94 Wednesday) by around 70 cents over the last two trading days.
El Paso Permian similarly gained 14 cents Wednesday to average $1.95, following up on a 38-cent gain posted the previous day.
The strong start to post-Labor Day trading for Waha has seen the West Texas point rebound from some of the widest negative basis differentials it’s seen in years. Just one week earlier, Waha spot prices averaged a measly $1.27 in trading on Aug. 29, $1.69 back of Henry Hub. November 2008 was the last time Waha traded at such a steep discount to Henry, and that was during a stretch when the Louisiana hub was routinely averaging above $6/MMBtu, Daily GPI historical data show.
The cash gains should also give Waha bidweek gas buyers reason to feel good, at least for now. Fixed price trading at Waha averaged $1.29 during September bidweek, a significant discount of more than 70 cents to Wednesday’s spot average, especially when considered in terms of percentage given the region’s depressed pricing because of import constraints.
© 2024 Natural Gas Intelligence. All rights reserved.
ISSN © 2577-9915 | ISSN © 2577-9877 |