Robust Production, Early Autumn Eases Natural Gas Forwards Values
Market bears have staked their claim on natural gas markets as forward prices moved lower across all of North America for the Aug. 23-29 period as record production and forecast waning heat in the coming weeks sent September forward prices down by an average 11 cents, according to NGI’s Forward Look.
The Nymex September gas futures contract led the move lower as the then-prompt month netted three consecutive days in the red before a bounce as it rolled off the board Wednesday. The September contract ultimately lost 7 cents to reach $2.895, while October slid 9 cents to $2.863.
At the heart of the week’s declines was record production. Genscape Inc.’s SpringRock group said production on Monday (Aug. 27) set another record high of 82.25 Bcf/d. In the 10 days leading up to Thursday, production has averaged about 81.6 Bcf/d, about 0.6 Bcf/d above the August month-to-date average, according to senior natural gas analyst Rick Margolin.
Meanwhile, market observers are looking for production to grow even more this fall as additional takeaway capacity goes online. Transcontinental Gas Pipe Line Co. LLC (Transco) has asked the Federal Energy Regulatory Commission for authorization to begin full service on its 1.7 million Dth/d Atlantic Sunrise expansion by Sept. 10. Transco previously added interim service associated with the completion of brownfield portions of the project, including an incremental 400,000 Dth/d that came online last August, and another 150,000 Dth/d approved to enter service in May.
Between Atlantic Sunrise and other recent expansions, including the start-up of two additional supply laterals on the Rover Pipeline Project, Marcellus and Utica shale producers will have more options to get their gas to market this winter.
Already, August has seen an additional 7 Bcf of takeaway capacity versus August 2017, according to Genscape. The increased takeaway capacity has had a positive effect on gas prices in Appalachia. In each of the last four summers (2014-2017), the firm has seen significant basis blowouts toward the end of the summer, with August cash prices averaging $1.45 below Henry Hub and October cash averaging $1.76 below the benchmark. The blowouts reflected capacity constraints in moving gas out of the supply region and into demand markets.
“These capacity constraints were the result of increased export requirements out of the region (driven by production growth) that continually outpaced available pipeline export capacity,” Genscape senior natural gas analyst Eric Fell said.
As of Aug. 29, however, Dominion cash prices sat less than 30 cents behind Henry Hub, and Dominion’s September forward contract settled 42 cents below the Nymex contract. The continuing strength in Dominion prices is an indication that this additional takeaway is easing the constraints seen in previous years, Genscape said.
“This summer, year on year (y/y) changes in local Mid-Atlantic demand (up an estimated 1.1 Bcf/d y/y) and an increase in exports from the region” via liquefied natural gas (LNG) (up 0.7 Bcf/d versus last summer) have also lent some strength to local basis, Fell said.
Although capacity expansions finally outpacing production growth is the primary reason for stronger basis this summer, the coldest April in more than 30 years contributed significantly to the storage deficit and lent some strength to summer basis, he said. Genscape’s current expectations for end-October inventories in the East region are 880 Bcf, 43 Bcf below last year’s October storage.
The storage picture in the East is not limited to that region. Gas stocks across the Lower 48 have trailed historical levels throughout the summer as intense heat has driven up demand in even less common regions like Southern California and the Pacific Northwest.
On Thursday, however, the Energy Information Administration (EIA) delivered perhaps what could be viewed as a positive sign of things to come as it reported a 70 Bcf injection into inventories for the week ending Aug. 24. The reported build was well outside of market consensus that had clustered around a build in the mid-60 Bcf range.
The net of the last two weeks yielded a better reading of balance, according to Bespoke Weather Services, which had projected a 66 Bcf build. Given the miss, however, the print indicated “weekly noise” in EIA data may be playing a role in these misses.
“This print confirms much of the demand-side loosening we observed last week that appears to have carried into this week, and also reflects the recent surge in production,” Bespoke chief meteorologist Jacob Meisel said.
The 70 Bcf build was significantly larger than both last year’s 32 Bcf build for the week and the five-year average injection of 59 Bcf.

Traders scoured the EIA data to find the missing link that caused the discrepancy between the estimated storage injection and the actual print. The Midwest region appeared to be culprit as mild temperatures and low humidity led to a 6 Bcf increase in injections week/week.
“Weather impacts start to get a little goofy though in the fall when you start getting moderate weather,” Weather Decision Technologies forecaster Stephen Strum said. “We had the windows open with temperatures in the mid-80s. We would have had the A/C on with the same weather in May.”
Broken down by region, the EIA reported a build of 35 Bcf in the Midwest, 27 Bcf in the East, 4 Bcf in the Mountain, and 2 Bcf each in the Pacific and South Central regions. Inventories as of Aug. 24 stood at 2,505 Bcf, 646 Bcf below last year and 588 Bcf below the five-year average.
Meanwhile, weather forecasts are also pointing to heftier injections in the weeks ahead as more comfortable weather patterns begin setting up after the first week of September. The European and Global Forecasting System (GFS) models were hotter trending with the pattern Sept. 5-10, according to NatGasWeather. Each slowed the weakening of hot high pressure that sets up to dominate most of the eastern and southern United States next week.
Despite a minor change in midday data, models overall were a little hotter trending from Wednesday to Thursday to add several cooling degree days, the forecaster said. Still, most data favor a more comfortable pattern setting up for much of the United States after Sept. 7-8.
NatGasWeather said the EIA’s storage report offered no change in the bigger picture “as deficits dropped to 588 Bcf…but should increase back toward 600 Bcf after next week’s EIA report accounts for hot conditions over the southern and eastern U.S. this week.”
Permian Constraints Reflected In Forwards
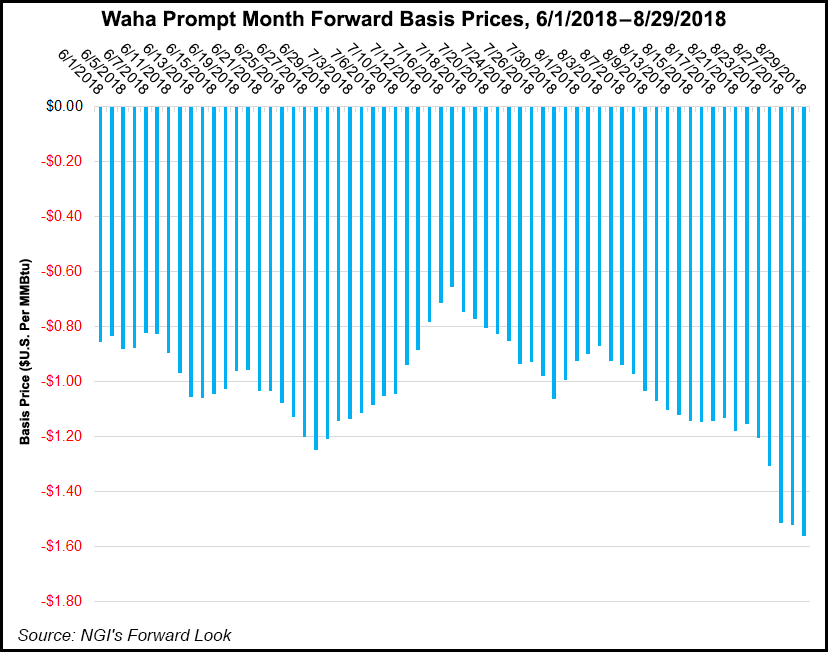
Aside from the benchmark Henry Hub, September losses across the continent were wide ranging, from as little as a nickel at Millennium East Pool to as much as 42 cents at Waha. The stout losses at Waha should come as no surprise as takeaway capacity in the region has largely hit its limits for both oil and natural gas in the Permian Basin.
“The Permian isn’t just a basin. It’s a phenomenon,” said RBN Energy CEO Rusty Braziel.
The end goal on the oil side is to get the Permian crude to the Gulf Coast and load it on ships for export to global markets. Midstream companies are working feverishly toward that goal. The same is true for all of the associated gas coming out of the basin, with pipeline companies looking to expand their facilities or build greenfield projects to send gas to the Gulf Coast, where demand continues to rise thanks to increasing exports to Mexico and overseas via LNG.
But with gas pipeline capacity still constrained, Waha cash prices have languished at about 90 cents below Henry Hub during August, sinking down to a spot price of $1.27 on Wednesday (Aug. 29), which was $1.69 below Henry Hub. That’s worse than the previous negative basis record of $1.42, which was set in April.
“Again, relief is on the way from midstreamers, but it is also a year away,” Braziel said.
As for forwards, Waha September plunged 42 cents from Aug. 23-29 to reach $1.335 ($1.56 below Henry), October tumbled 43 cents to $1.23 ($1.63 below Henry) and the winter 2018-2019 strip dropped 29 cents to reach $1.48 ($1.50 below Henry), according to Forward Look.
The picture was only somewhat rosier at El Paso-Permian, where September fell 35 cents to $1.47, October slid 33 cents to $1.34 and the winter 2018-2019 lost 23 cents to reach $1.52.
Both points, however, showed marked strengthening by the winter 2019-2020, which is when some of the recently announced pipelines are expected to begin service. El Paso-Permian winter 2019-2020 prices sat Wednesday at an 85-cent discount to Henry Hub, while Waha winter 2019-2020 prices were at an 88-cent discount, Forward Look data show.
Elsewhere across the country, there were a handful of other big losers for the Aug. 23-29 period, with several pricing locations in the Northeast posting declines of more than 20 cents at the front of the curve because of expectations that the unrelenting heat blanketing much of the eastern United States will finally subside in the coming weeks.
Southern California also put up substantial decreases as regional temperatures were expected to return to more seasonable levels soon. SoCal Border Avg. September dropped 27 cents to $2.737, October fell 20 cents to $2.382 and the winter shed 26 cents to reach $2.97.
© 2024 Natural Gas Intelligence. All rights reserved.
ISSN © 1532-1231 | ISSN © 2577-9877 |