U.S. Tight Oil E&Ps, OPEC Struggling for Supremacy, Says BP
Natural gas production, which climbed worldwide by 3% in 2017, provided the single largest contribution to primary energy growth, but the showdown between U.S. tight oil producers and the Organization of the Petroleum Exporting Countries (OPEC) continued to bring the drama last year.
BP plc on Wednesday unveiled the 67th annual BP Statistical Review of World Energy, outlining highlights during a webcast from London. Chief economist Spencer Dale, accompanied by Group CEO Bob Dudley, offered insight on longer term trends and shorter term developments affecting all things energy-related, as well as carbon emissions trends. BP also for the first time offered an analysis of the global power markets.
Dale, who led the audience through the overview, centered a big chunk of his commentary around the oil markets, noting that when last year’s BP review was published, flows of oil production and consumption had come broadly back into balance, but inventories were at record-high levels.
“OPEC, together with 10 non-OPEC countries led by Russia — sometimes known as the Vienna group — had begun to implement their promised cuts in oil production in order to accelerate the adjustment in inventories,” he said. “But U.S. tight oil had started to pick up, threatening to offset the impact of the production cuts.”
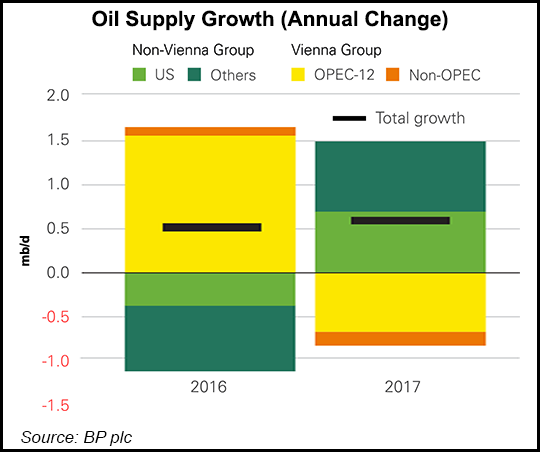
OPEC’s voluntary supply cuts reduced global impact, but U.S. tight oil production only accelerated.
“At an aggregate level, output growth in 2017 of 0.6 million b/d was similar to that in 2016,” Dale said. “But the pattern of that growth flip-flopped quite sharply. After growing by 1.6 million b/d in 2016, output by OPEC and other members of the Vienna group fell 0.9 million b/d last year as the cuts in production took effect.
“In contrast, after falling in 2016, oil production by countries outside of the Vienna group grew by 1.5 million b/d, led by the U.S. and a bounce back in Libya,” which was not part of the Vienna agreement.
The impact of the production cuts by OPEC and its allies “would have been even bigger” if not for the gains in U.S. tight oil and natural gas liquids, which have grown by almost 2 million b/d since October 2016, Dale said.
“Indeed, the pace of this second wave of growth in U.S. tight oil seen over the past 18 months or so is comparable to the rapid growth seen in 2012-2014, even though prices in the earlier period were materially higher. The scale of the increase in U.S. tight oil meant the impact of the production cuts was increasingly offset as we moved through 2017.”
The speed and scale of the actions by OPEC “mean that it continues to have the ability to smooth temporary disturbances to the oil market. But the relatively rapid response of U.S. tight oil reinforces the limits on OPEC’s power.”
If OPEC and its allies were to try and resist “more permanent or structural changes in the market, there is an increasing risk that these actions will quickly be cancelled out by the responsiveness of U.S. tight oil,” he said.
Oil demand since last year has grown by 1.7 million b/d, similar to 2016 levels and “significantly greater” than the 10-year average, Dale said. “To put the recent strength of oil demand in context, average growth over the past five years is at its highest level since the height of the commodity super-cycle in 2006-07…”
Not surprisingly, he said, last year’s oil demand continued to be driven by oil importers benefiting from the windfall in low prices, with both Europe (0.3 million b/d) and the United States (0.2 million b/d) “posting notable increases, compared with average declines over the previous 10 years.”
He cautioned that there are some signs in the product mix that the gains from low oil prices may be waning.
Meanwhile, last year was a “bumper year for natural gas,” Dale said, with both demand and production climbing at their fastest rates since the immediate aftermath of the financial crisis in 2008-2009. A central factor supporting the strengthening gas markets is liquefied natural gas, which increased by more than 10% in 2017, its strongest growth since 2010, aided by Australia and U.S. export trains.
Growth in gas consumption last year was led by Asia, with strong growth in China (15.1%, 31 bcm), supported by increases in the Middle East (Iran 6.8%, 13 bcm) and Europe.
Consumption gains were more than matched by increasing production, particularly in Russia (8.2%, 46 bcm), supported by Iran (10.5%, 21 bcm), Australia (18%, 17 bcm) and China (8.5%, 11 bcm).
Coal production also had a “mini-revival” last year, with worldwide output increasing more strongly, driven by notable increases in China and the United States, where output climbed almost 7%.
“Interestingly,” said Dale, “the increase in U.S. production came despite a further fall in domestic consumption, with U.S. coal producers instead increasing exports to Asia.”
© 2024 Natural Gas Intelligence. All rights reserved.
ISSN © 2577-9877 | ISSN © 2158-8023 |