Markets | Mexico | NGI All News Access | NGI The Weekly Gas Market Report
Additional Marketer Information Forces Mexico’s CRE to Revise February Natural Gas Prices
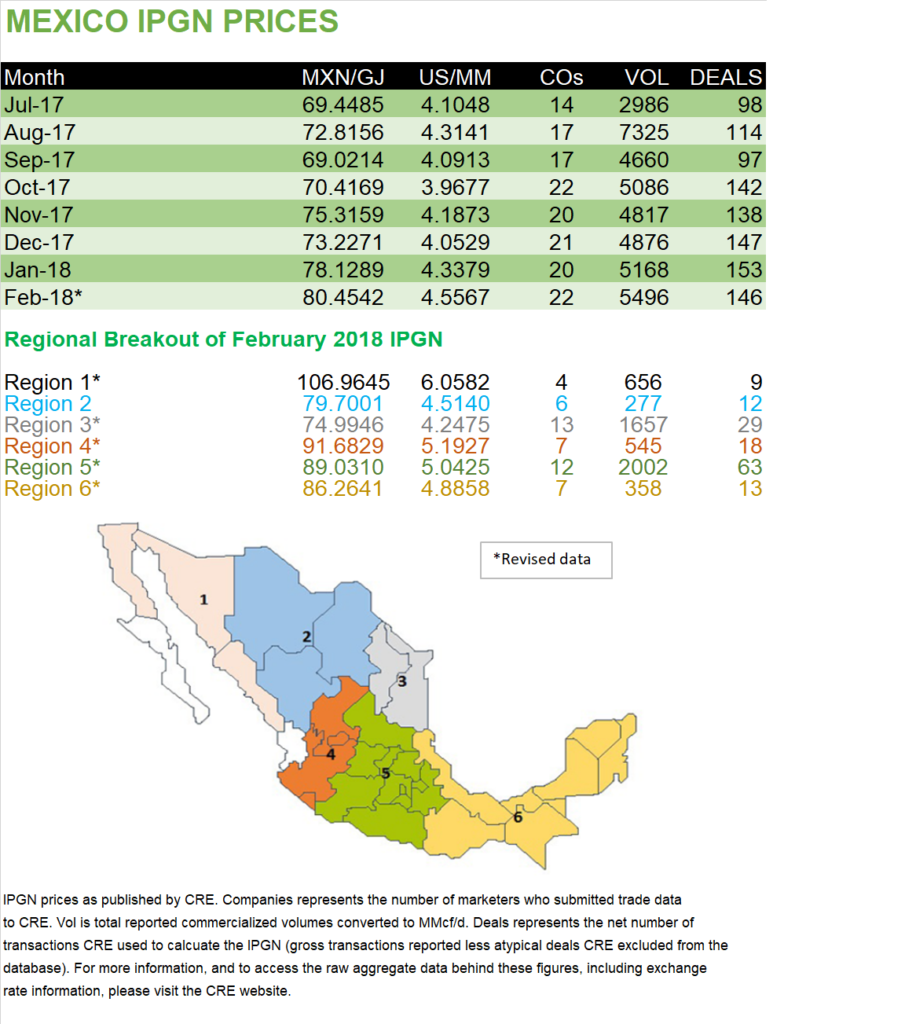
The Mexican energy regulator in late March revised the natural gas pricing data published for February, the first month to offer a regional breakout of trading activity within the country.
The updated data incorporated “additional information reported by marketers,” according to the Comision Reguladora de Energia (CRE).
The revised CRE pricing information affects the prices and volumes reported for all six of CRE’s trading regions, except Region 2. One of the biggest changes occurred in Region 1, where the price is roughly doubled based on the revised data. The trading volumes reported in regions 1 and 3-6 all increased, most notably in Region 5, where it more than doubled.
At a national level, the average price of natural gas decreased by slightly more than 1 peso with the new data for February. However, the revisions caused the total monthly trading volume to increase by 76.1%.
The number of deals reported in February, as well as the number of marketers that transacted in the month, remained unchanged.
Mexico GPI initially published the data on March 21, and has since incorporated the new pricing data from CRE. As of April 3, the February prices have also been updated in the Mexico IPGN Prices table.
The prices, which correspond to February, ranged from 74.995 pesos/gigajoule (GJ) in northeast Region 3 to 106.965 pesos/GJ in the northwest Region 1, or $4.248/MMBtu to $6.058/MMBtu, according to the CRE.
The national average for the month was 80.454 pesos/GJ ($4.557/MMBtu), compared to 78.129 pesos/GJ (US$4.338/MMBtu) in January.
CRE calculated the prices using data collected from the monthly post-transaction reports that are mandatory for all gas marketers operating in Mexico. The resulting indices showed an average price, combining the price per molecule and transport costs, for all trades billed in each region during the previous month.
During February, 22 marketers reported 153 trades for a total volume of 153.9 Bcf, according to the regulator. Seven statistically atypical trades were excluded before calculating the final prices.
The regulator unveiled in late February the six trading regions, based on supply patterns, Mexico’s pipeline infrastructure, and the prices and volumes reported in each state, among other factors. The six areas encompass the Federal District and all but two of Mexico’s 31 states, with regions 1-3 covering the northern half of the country and regions 4-6 covering its central and southern states.
Region 5 recorded the most deals and highest volume for the month. A total of 12 marketers billed 68 transactions for a combined volume of 56.1 Bcf, with an average price of 89.031 pesos/GJ ($5.043/MMbtu)
Located in central Mexico, Region 5 encompasses some of Mexico’s most densely populated areas, including Mexico City. The Los Ramones system, carrying gas imports from South Texas, terminates in Region 5, where it links up with other pipelines on the national Sistrangas network.
In volume and deals, northeast Region 3 was the second-most active trading zone. In February, 13 marketers reported 30 transactions for a total of 46.4 Bcf. The average price of those trades was 74.995 pesos/GJ ($4.248/MMBtu), the lowest among all six regions.
Region 3 covers the industrialized states of Nuevo Leon and Tamaulipas. Gas imports from South Texas flow into this region at numerous border crossing points, including NET Mexico at Rio Grande, TX, which accounts for slightly under half of all U.S. pipeline shipments into Mexico. The NET Mexico pipeline interconnects with the Los Ramones system at Camargo in Mexico.
Most of the pipelines in Region 3 are part of the Sistrangas, but it also includes Kinder Morgan Inc.’s Mier-Monterrey, which terminates near the Nuevo Leon capital of Monterrey. Also in Monterrey, the Nueva Era cross-border pipeline, a joint venture between Howard Energy Partners and Mexico’s Grupo Clisa, is due in service later this year.
The northwest Region 1, which saw the highest average price for February, also reported the fewest transactions. Four marketers billed nine deals for total monthly trading volume of 18.3 Bcf. The region includes the Sonora pipeline, which runs from the Arizona border to the coast of the Sea of Cortez into Sinaloa state.
Since August, a force majeure on the pipeline’s Guaymas-El Oro segment, the result of a social conflict, has curtailed shipments from the Sasabe, AZ border crossing. The isolated Naco-Hermosillo and Baja California systems are also in Region 1.
In Region 2, private pipelines connected to West Texas imports points and the northwest section of Sistrangas converge near El Encino in Chihuahua state. There have been delays to several Mexican pipelines that would move gas imports from the Waha hub downstream into this region, but most are expected to come in service by the end of this year or early 2019.
Six marketers billed 13 transactions in Region 2 for a total trading volume of 7.8 Bcf, the lowest among all six regions, with an average price of 79.700 pesos/GJ ($4.514/MMBtu). Region 4 in southwest Mexico recorded a trading volume of 15.3 Bcf for February, and Region 6 in the southeast reported 10 Bcf.
Last August, CRE began publishing a national version of the monthly index, known as the IPGN. At the time, officials said the regulator would begin releasing regional prices once it had collected enough transaction data to identify specific trading areas and liquidity points within Mexico.
The regulator also plans to create a set of forward-looking price indexes, using data culled from the daily trading reports that Mexican marketers are also required to file. These would include a daily index showing the average price of all trades scheduled for next-day flow, as well as a monthly index of trades with flow dates on the following month.
Like with the IPGN, the CRE expects to first publish national versions of these indexes and eventually roll out regional prices.
The CRE indexes, also known as price reports, are intended to be indicative and temporary. Officials have said they expect to cease publication once the market is able to develop indexes on its own.
Currently, most trades in the Mexican gas market are priced with U.S. indexes like Henry Hub and Houston Ship Channel, plus the cost of transport.
Last year, Mexico imported around 5 Bcf/d to supply 62% of national gas demand, which averaged 8.07 Bcf/d, according to the Energy Ministry (Sener). Pipelines delivered 4.36 Bcf/d of Mexican gas imports in 2017, while the remaining 643 MMcf/d came from two of the country’s liquefied natural gas (LNG) terminals.
The Altamira LNG terminal is on the Gulf Coast in Tamaulipas, near the border between the CRE’s regions 3 and 6 and not far from central Region 5. The Manzanillo terminal is on the Pacific Coast in the state of Colima, which is part of Region 4. A third LNG import facility in Baja California, in Region 1, has not received any cargos since mid-2016.
© 2024 Natural Gas Intelligence. All rights reserved.
ISSN © 1532-1231 | ISSN © 2577-9877 | ISSN © 1532-1266 |