NGI The Weekly Gas Market Report | E&P | LNG | NGI All News Access
Fifth Straight Month of Year/Year NatGas Production Increase in October, EIA Says
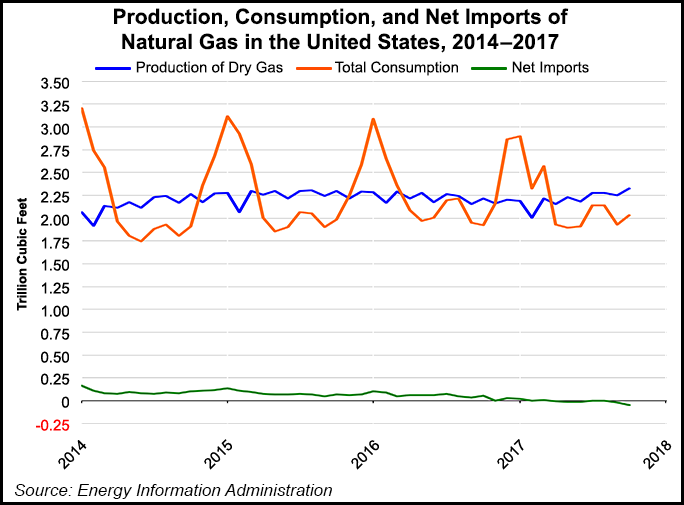
U.S. dry natural gas production was 2.33 Tcf (75.1 Bcf/d) in October, a 5.2% increase from 2.21 Tcf (71.4) in October 2016, marking a fifth straight month of year/year increases, the Energy Information Administration (EIA) said Tuesday.
It was the highest dry gas production in any October since the agency began tracking monthly dry production in 1973, EIA said in its latest Natural Gas Monthly report.
But production through the first 10 months of 2017 still trailed 2016. Total domestic dry gas production through October was 22.11 Tcf, compared with 22.29 Tcf during the first 10 months of 2016 and 22.56 Tcf during the same period of 2015, EIA said.
Full-year 2016 output fell to an estimated 26.5 Tcf (72.4 Bcf/d) from the record 27.1 Tcf (74.2 Bcf/d) in 2015, but was still above the 25.9 Tcf (71.0 Bcf/d) recorded in 2014, according to EIA data.
Output fell year/year during the first five months of 2017, but EIA reported year/year increases without break beginning in June.
Production estimates are based on data from the EIA-914, Monthly Crude Oil, Lease Condensate, and Natural Gas Production Report.
Natural gas consumption also increased in October, reaching 2.04 Tcf (65.6 Bcf/d), a 5.7% increase compared with 1.93 Tcf in October 2016, and the highest level for the month since EIA began tracking monthly consumption using current methodology 16 years ago. The year-to-date consumption total of 21.68 Tcf trails the 22.45 Tcf total through October 2016.
Year-over-year total dry gas consumption in October increased in all four consuming sectors, EIA said. Residential deliveries were 6.5 Bcf/d in October, an 8.6% increase from 6.0 Bcf/d a year earlier, and commercial deliveries were 6.5 Bcf/d, a 4.7% increase from 6.2 Bcf/d in October 2016. Both residential and commercial deliveries were the highest for an October since 2014.
Industrial deliveries were 21.1 Bcf/d, a 5.0% increase from 20.1 Bcf/d a year earlier, and electric power deliveries were 25.3 Bcf/d, a 5.8% increase from 23.9 Bcf/d. Industrial deliveries were the highest for and October since EIA began using the current definitions for consuming sectors in 2001, and electric power deliveries were the second-highest level for an October since 2001.
The United States has been a net exporter of natural gas in several recent months, tallying 65 Bcf total net exports in the first 10 months of 2017, compared with 638 Bcf of total net imports through the same period in 2016 and 807 Bcf of net imports in 2015. In October, net gas exports were 45 Bcf (1.5 Bcf/d), compared with 55 Bcf (1.7 Bcf/d) of net imports in October 2016.
“The increase in exports continues to be driven by liquefied natural gas (LNG),” EIA said. “LNG exports in October 2017 were more than 25 times higher than in October 2016. In October 2017, the United States exported 2.6 Bcf/d of LNG to 10 different countries.”
Countries that received U.S. LNG in October included China (24.6 Bcf), South Korea (21.6 Bcf), Mexico (7.1 Bcf), Brazil (7.0 Bcf) and Japan (6.7 Bcf). Total LNG exports for the first 10 months of 2017 were 544.9 Bcf, nearly five times the 112.0 Bcf exported during the same period on 2016.
The United States in October also exported 130.6 Bcf to Mexico via pipelines, compared with 129.9 Bcf in October 2016. It also exported 64.2 Bcf to Canada via pipelines, versus 43.5 Bcf in October 2016.
© 2024 Natural Gas Intelligence. All rights reserved.
ISSN © 1532-1231 | ISSN © 2577-9877 | ISSN © 1532-1266 |