January NatGas Bidweek Marked by Bearish Futures, Late-December Arctic Chills
Winter’s arctic freeze along the East Coast and the Midwest was enough to overcome lingering December weakness in the rest of the country, promoting NGI’s January Bidweek National Average price by 24 cents to $3.36/MMBtu.
As bidweek arrived, most of the Midwest and Northeast were dealing with frigid temperatures that moved into the Lower 48 around the Christmas holiday and lingered into early January. Despite the boost, the January 2018 national average came in 95 cents below January 2017.
In trading on Tuesday, the chill was more prevalent, as the Chicago Citygate for Wednesday delivery surged $4.386 to average $9.012, according to NGI’s Midday Alert Prices, which includes Intercontinental Exchange trade data and is published shortly after 1 PM CT each business day by NGI.
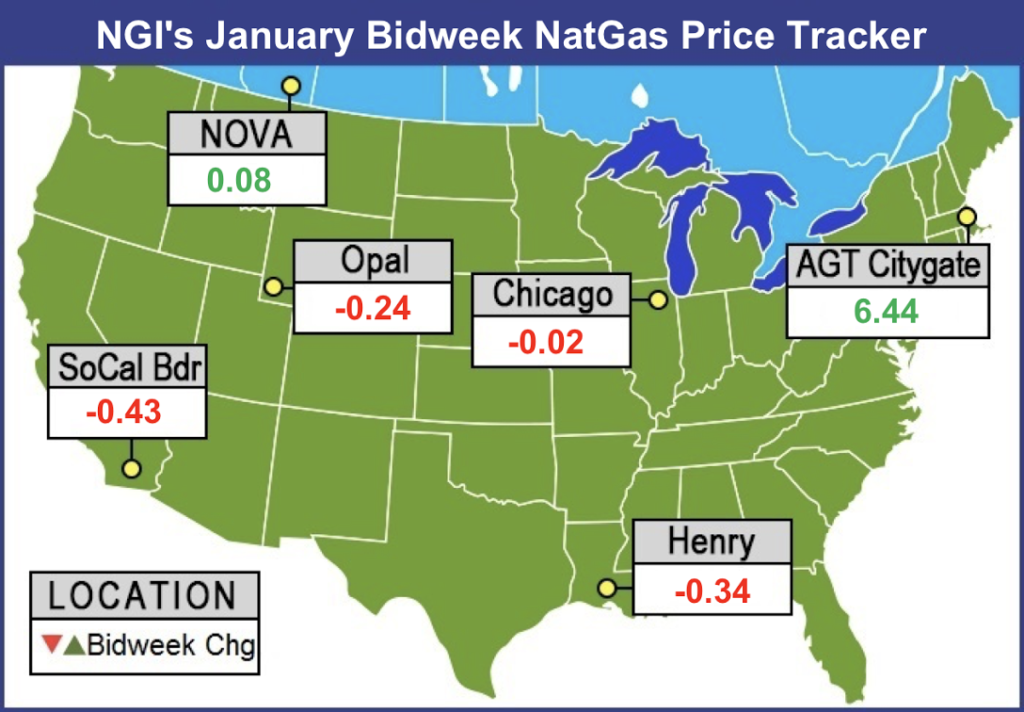
For Jan. 2018, points in the volatile Northeast saw big increases over December bidweek. Algonquin Citygate more than doubled, adding $6.44 to average $12.25. Tennessee Zone 6 200L gained $5.83 to $12.24, while Transco Zone 6 New York added $3.39 to average $7.72.
Tetco M3 Delivery also experienced a weather-driven bump, adding $1.96 to $5.16, as did Transco Zone 5, which notched a $1.98 increase over December bidweek prices to average $5.65.
In the Midcontinent, bidweek prices at Ventura, IA, finished higher, bearing the imprint of a late-month spot market blowout that saw day-ahead prices at Northern Natural Ventura climb as high as $100 last Thursday because of frigid conditions.
Northern Natural Ventura added 43 cents in January bidweek trading to average $3.51, while Northern Border Ventura added $1.27 to average $4.37. In trading on Tuesday for Wednesday delivery, Northern Natural Ventura added $3.375 to average $8.589, while Northern Border Ventura added $2.874 to average $8.065.
Meanwhile, the bone-chilling conditions late in the month couldn’t move the bidweek needle higher in the Midwest. Chicago Citygate finished 2 cents lower month/month to average $3.08, while Dawn gave up 22 cents to $3.03.
In the West, bidweek prices at SoCal Citygate eased off of elevated levels the month before. SoCal Citygate gave up $2.50 to average $3.88 for January bidweek. This came after utility Southern California Gas announced on Dec. 22 that it completed maintenance on Line 4000, restoring receipts through Needles, CA, in its Northern Zone.
For the most part, bidweek averages moved lower in step with the January futures contract, where the bears had control for much of December. January came off the board at $2.738, needing a late-month rally to get there.
When it comes to natural gas futures, “December has been frustrating,” Societe Generale analyst Breanne Dougherty said in a late December note. “First, erratic shifts in weather patterns have prevented any firm bullish sentiment from forming, even when the 15-day forecast turns constructive.
“Second, the market has decided to prove once again that it has a mind of its own and fundamental support isn’t always required,” she said. “Third, the nature of trading in today’s market means that even a small shift in sentiment can become a dramatic self-fulfilling prophecy.”
Even with strong production and inconsistent demand, “there is a lot of winter left,” according to Dougherty, who noted that Societe Generale revised lower its Calendar 2018 price forecast by 20 cents to $3.05/MMBtu.
Production growth in 2018 “needs to continue outpacing demand growth in order to bring the market back to true equilibrium. Bottom line: The aggressive downward shift in the Calendar 2018 curve looks to us like it has gone too far…We see first quarter 2018 as undervalued especially.”
After a disappointing December, January is shaping up to be a different story. In its first few days as the prompt month, the February contract picked up where the January contract left off, gaining on sustained below-normal temperatures driving up heating demand across the eastern two-thirds of the Lower 48. February was trading back above $3 as of early Tuesday afternoon.
The natural gas market kicked off 2018 with a bang, thanks to a demand day exceeding even the peak of the polar vortex winter of 2013/14, according to PointLogic Energy Vice President Jack Weixel.
“On Jan. 1, the U.S. natural gas market was up early and flexing its considerable demand muscles,” Weixel said. “No hangover was evident as total demand registered an impressive 148.8 Bcf/d, beating out levels seen at the height of the Polar Vortex four years ago on Jan. 7, 2014, by over 5.4 Bcf/d…
“The difference maker this year is exports. While domestic demand came in at an impressive 131.1 Bcf/d, second to Jan 7, 2014 by just 0.1 Bcf/d, net exports totaled 7.5 Bcf/d, which along with pipe loss and fuel led to the record-smashing total demand tally. Liquefied natural gas exports came in just under 3.3 Bcf/d on Jan. 1, narrowly missing its single-day record day set on Dec. 9, 2017.”
Genscape Inc. said in a recent note that after “grossly mild temperatures” and weak demand earlier in the winter heating season, “time was running out to sufficiently draw down inventories, especially given the strong production numbers we’ve been seeing…That all changed around Christmas. From Nov. 1-Dec. 24 there were no plus-100 Bcf/d demand days…and just 10 days where demand exceeded 90 Bcf/d.” But on Christmas Day, “demand jumped to 97 Bcf/d and has run well above 100 Bcf/d every day since.”
Given the recent cold blast, the market will be looking with interest to the first few storage reports of 2018. Genscape told clients that its preliminary estimate based on pipeline supply/demand balance pointed to a storage draw of around 191 Bcf for the week ending Dec. 29, with the estimate for the week ending Jan. 5 increasing from a draw of 240 Bcf to a draw of 255 Bcf.
The Energy Information Administration (EIA) reported a net 112 Bcf withdrawal from U.S. gas stocks for the week ending Dec. 22, versus 233 Bcf withdrawn a year ago, and a five-year average withdrawal of 111 Bcf.
Total working gas in underground storage stood at 3,332 Bcf as of Dec. 22, according to EIA. The year-on-five-year deficit increased by one to -85 Bcf for the period, while the deficit versus last year shrank from -183 Bcf to -62 Bcf, EIA data show.
As 2017 came to a close, forecasts were finally showing enough heating demand to impress the futures market, though questions remained for the bulls after a relatively weak performance on the last trading day of December. The February contract settled at $2.953 Friday, up 3.9 cents on the day. That’s a big increase from February’s $2.658 settlement the week before, but perhaps less than convincing given how far the mercury was dropping in key Midwest and East Coast markets.
“Despite the solid last couple days we’ve seen in natural gas, that really has only gotten us back into the bottom of the extended trading range the market has been in the last several months,” Powerhouse’s David Thompson, executive vice president, told NGI last Friday. “The coldest blast of the year so far has only gotten us back in the range. That’s something the bulls, I think, have to be a little worried about. Is this all they can get?”
Thompson noted the contrast between natural gas and heating oil markets in terms of how they reacted to the recent frigid conditions.
“The thing that needs to be resolved one way or the other is why is the heating oil market reacting as one would intuitively expect given the weather, while natural gas has run out of steam at this point? The only difference, I would say, between the two is the producer hedging action,” Thompson said, noting that when front-month prices climbed above $3 it seemed to yield attractive enough prices across the curve to incentivize producer hedging.
While production growth remains a long-term concern for natural gas bulls, weather-driven constraints and supply shortages had the market’s attention in the near-term as the calendar rolled over to 2018.
“Freeze-offs across the Lower 48 continue to choke back volumes,” Genscape said in a note to clients Tuesday. Genscape’s Spring Rock daily pipe estimate “has current volumes below 72 Bcf/d, though, as always we urge caution with first-of-month nominations data on production points. On Dec.31, production was estimated to have fallen to a 43-day low of 74.8 Bcf/d.
“On the demand side, Lower 48 consumption has stayed above 100 Bcf/d since the day after Christmas and stands at an estimated 111 Bcf/d Tuesday.”
Bespoke Weather Services said in a recent note that it would be watching for “long-range warmer risks” even as cold shots arriving around Jan. 10-11 and Jan. 14-15 “appear enough to at least temporarily provide a bit more upside for natural gas prices.
“With such intense short-term cold, stockpiles are likely to be depleted enough to significantly increase weather sensitivity over the coming weeks, meaning a couple more cold shots have clearly been able to boost the front of the natural gas strip,” Bespoke said. “…The technical picture has severely weakened with prices reversing overnight, and we see a bit of resistance at $3.02 with very strong resistance from $3.10-3.12.”
Upcoming EIA storage inventory data “should be very supportive for the front of the strip, but for any rally to be sustained the whole strip must participate,” which was “finally” starting to happen after recent freeze-offs impacting production. “Yet continued warming trends into late January could reverse these trends and ease any concerns about late-winter shortages.”
© 2024 Natural Gas Intelligence. All rights reserved.
ISSN © 1532-1258 | ISSN © 2577-9877 |