NGI Weekly Gas Price Index | Markets | NGI All News Access | NGI Data
NatGas Markets Look Ahead to Heating Demand Arriving Over Holiday Break
Natural gas markets spent the week looking ahead — to an extended holiday weekend, perhaps, and to the arrival of widespread frigid temperatures starting around Christmas Day. Most points traded near even, while prices in the Northeast and out West flashed some volatility, and the NGI Weekly Spot Gas Average fell 5 cents to $2.91/MMBtu.
In the Northeast, some points retreated from weather-driven gains the week before, such as Transco Zone 6 New York, which averaged $2.85 for the week, down 79 cents despite a strong day/day performance to close out the week. The capacity-constrained Algonquin Citygate finished 64 cents higher at $8.66 after some price swings during the week.
Transco Zone 5 also pulled back after a strong performance the week before, giving up 74 cents to $2.88 and dragging down the Southeast regional average in the process.
Prices in the Rockies were mixed. Most points finished higher week/week, including Cheyenne Hub, which added 10 cents to $2.48. Kingsgate, meanwhile, fell 8 cents to $2.33.
With some cold temperatures moving into the Northwest, Northwest Sumas had a strong week, adding 49 cents to average $3.19.
Forwards at Sumas also gained during the week, according to Forward Look. Sumas January forwards jumped 40 cents from Dec. 15-21 to reach $2.975, while February rose 24 cents to $2.36 and the balance of winter (February-March) climbed 19 cents to $2.11.
Out West, prices at SoCal Border Average — along with prices in the Arizona/Nevada region — surged during the week before pulling back on Friday.
Southern California Gas (SoCalGas) notified customers Friday that its Line 4000 Maintenance — expected to restore capacity through the utility’s Needles receipt point along the California/Arizona border — was complete. As a result, SoCalGas will be able to receive 870 MMcf/d through its Northern Zone, including the restoration of 270 MMcf/d of capacity through Needles, according to the utility.
SoCal Border Average finished the week 54 cents higher at $3.42. El Paso S. Mainline/N. Baja added 60 cents to $3.60, while Kern Delivery jumped 49 cents for the week to average $3.37.
Futures finished higher week/week, but after the market brushed off a seemingly bullish government storage report, it appeared the bears were in control. After trading as high as $2.673 Friday on reduced volume, the January contract — set to expire in the coming week — settled 6.9 cents higher at $2.667, bouncing back from contract lows set the day before. February settled 6.6 cents higher at $2.658 Friday.
Last Friday, January settled at $2.612, a steep drop from $2.772 the week before that.
“We’ve established that we’re no longer in the range” of $2.75-3.20 “and the market’s behaving as such,” Powerhouse President Elaine Levin told NGI. “I think that’s really the big story. You have a resolution of a trading range to the downside, and really other than testing old support as new resistance, this has been textbook.”
That prices moved lower despite a supportive storage report from the Energy Information Administration (EIA) serves as “an even more bearish confirmation of the technical break, if a fundamental news story couldn’t push it through an important technical number.”
EIA on Thursday reported a larger-than-average storage withdrawal that exceeded consensus estimates, and prices got a bounce after some overnight selling. But even with the bullish miss, the market failed to sustain any kind of rally, and the bears ultimately won the day.
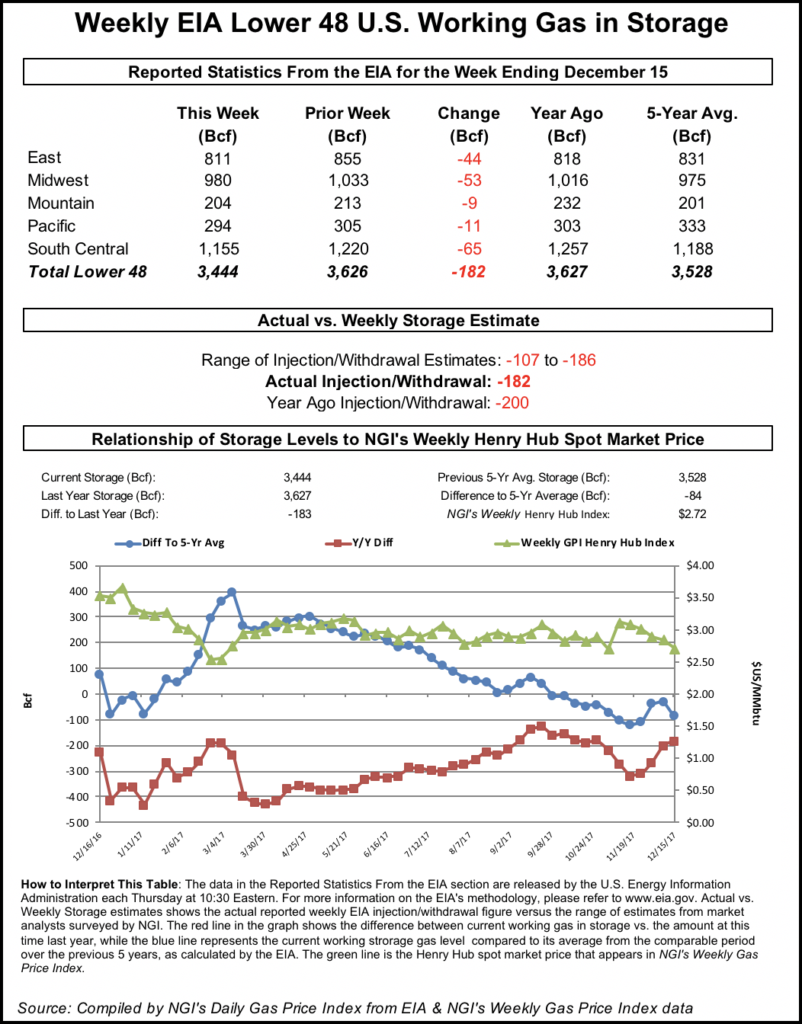
EIA reported a net withdrawal of 182 Bcf from U.S. gas stocks for the week ended Dec. 15, about 10 Bcf to the bullish side of the average of predictions leading up to the report. That’s versus a 200 Bcf draw in the year-ago period and a five-year average pull of 125 Bcf.
The -182 Bcf reported for the week ranks as the fifth largest weekly withdrawal for the month of December since 2010. The largest was -285 Bcf reported for the week ended Dec. 13, 2013, an NGI analysis of EIA historical data shows.
After selling off into the $2.580 area prior to the open, the January contract gained steadily through the morning before seeing a noticeable uptick when the final storage figure crossed trading desks at 10:30 a.m. EDT. The prompt month traded as high as $2.669 in the minutes immediately following the report.
But shortly after 11 a.m. EDT, January — set to expire next week — was trading back around $2.623, down about a penny from Wednesday’s settle.
Prior to the report, traders and analysts had been looking for a large withdrawal, but not as large as the actual figure.
A Reuters survey of traders and analysts on average predicted a 170 Bcf draw for the period. Responses ranged from -107 Bcf to -186 Bcf.
Stephen Smith Energy Associates was calling for a 175 Bcf draw from U.S. gas stocks for the week ended Dec. 15, based on 16 total degree days more than normal for the period. That’s versus a seasonally normal draw of 145 Bcf (based on 2006-2010 norms), the firm said.
PointLogic Energy estimated that EIA would report a 172 Bcf draw for the period. “The significant increase in week-on-week withdrawals comes amid demand gaining nearly 18.5 Bcf/d week-on-week,” analysts said in a note to clients.
Kyle Cooper of IAF Advisors was looking for a withdrawal of 176 Bcf, while Price Futures Group was calling for a pull of 155 Bcf.
Bespoke Weather Services said the bullish miss “seems to indicate more significant demand from the first cold shot of December than the market had priced in thus far.
“Though production has been the central focus, the market has yet to see how truly cold weather would flex demand; this impressive print would seem to present further upside for prices, and is seen as very tight along all historical metrics,” the firm said. “Should weather forecasts hold it would seem to put a $2.75 re-test back in play.”
Total working gas in underground storage ended the week at 3,444 Bcf, according to EIA. That’s versus 3,627 Bcf in the year-ago period and a five-year average of 3,528 Bcf. The year-on-five-year deficit increased for the week from -27 Bcf to -84 Bcf, while the deficit versus year-ago stocks narrowed from -201 Bcf to -183 Bcf, EIA data show.
All regions reported a net withdrawal for the period, led by the South Central at -65 Bcf, including 30 Bcf withdrawn from salt and 35 Bcf withdrawn from nonsalt. The Midwest saw a -53 Bcf net change to inventories, while the implied flow in the East was -44 Bcf for the week.
In a shortened trading day Friday ahead of the Christmas holiday, natural gas futures nosed higher as forecasts continued to show frosty weather through the end of the year.
Arctic air was expected to begin dropping temperatures to below-normal levels in parts of the country over the long weekend, helping lift the NGI National Spot Gas Average 26 cents to $3.03/MMBtu.
Forecasts ahead of the extended weekend continued to show the potential for significant heating demand.
In its six- to 10-day forecast Friday, MDA Weather Services said, “Overall, this remains a broadly colder than normal period nationally and includes much and strong below normal coverage from the Midwest to the East. This comes downstream of ridging over Alaska and the Bering Sea, features which are strong enough to provide a pathway for cold arctic air directed toward the Lower 48.
“Additional cold risk is associated with this setup, particularly through the mid-period in the East nearby the polar vortex.”
As for PointLogic Energy’s latest six- to 10-day Friday, analyst Alan Lammey said the firm saw U.S. population-weighted temperatures averaging 30.8 degrees during the period, about 0.9 degrees colder than average.
“The five-day timeframe will start with a stronger southern storm that develops and tracks northeastward over the Ohio Valley and into interior New England from Dec. 27 through Dec. 29. Currently, the weather development looks to become a snow-to-rain event for the large metropolitan cities and locations of the Interstate 95 corridor, while a larger snow event may occur along the more northern portions of the Northeast.
Across the northern United States for the period, “the major models are indicating that generally cold temperatures producing conditions that are 10-15 degrees below normal…will be commonplace for much of” the six- to 10-day, Lammey said. “Elsewhere, the upper Midwest is projected to see potentially some of the brutally coldest temperatures in the nation.”
But even with supportive weather, not to mention a bullish 182 Bcf storage withdrawal reported by the Energy Information Administration Thursday, the technical picture for natural gas shifted after January broke below long-standing support around $2.750.
NatGasWeather.com said how long the cold sticks around in the new year could determine how the market responds following the Christmas break.
“Essentially, the onus is clearly on cold lasting after Jan. 4 when considering the Arctic blasts expected prior to then failed to rally this market,” the firm said. “Why prices sold off so strongly in spite of this cold pattern can only be explained fundamentally by record production.
“Therefore, it is quite difficult to know how the markets open after the break since cold weather patterns don’t seem to matter one bit to whatever entities were doing all the selling this week.”
U.S. drillers tacked on another natural gas-directed rig ahead of the holiday, according to data released Friday by Baker Hughes Inc. (BHI). After netting one rig overall, the United States ended the week with 184 natural gas units, up from 129 running a year ago.
Earlier in the week, EIA released its Drilling Productivity Report, predicting that the Marcellus and Utica shales will lead gas production growth in January, averaging an estimated 26.37 Bcf/d, up from 26.03 Bcf/d in December.
Meanwhile, the Ohio Department of Natural Resources released data recently showing Utica Shale producers grew their output 27.5% year/year and 18.5% sequentially during the third quarter.
PointLogic Energy’s data showed Northeast production approaching 27 Bcf/d for Friday and averaging around 26.7 Bcf/d month-to-date.
As of Friday, the combined Marcellus/Utica rig count stood at 75, up from 59 a year ago, according to BHI.
In the spot market Friday, cold temperatures were expected to begin pouring into the northern United States and Midwest over the long weekend, enough to lift prices for multi-day deals.
The Midwest Regional Average climbed 10 cents to $2.66, helped along by double digit gains at points like Chicago Citygate and Joliet.
MDA was expecting temperatures in Chicago and Cincinnati to drop to below-normal levels — including lows in the teens and 20s — by Monday.
In the Midcontinent, prices at Northern Natural Demarcation jumped 13 cents to $2.64. The pipeline put out a safe operating limit alert to customers across all zones for the Dec. 25 and Dec. 26 gas days, citing “lower than normal system-weighted temperatures.”
In the Southeast and Mid-Atlantic, Genscape Inc. was forecasting demand to ramp up to 18.82 Bcf by Christmas Day, up from a prior seven-day average of 16.1 Bcf/d, and spot prices firmed throughout the region. Transco Zone 5 surged 69 cents to $3.27, while Transco Zone 4 climbed 7 cents to $2.62.
AccuWeather on Friday called for lows in Boston to dip into the 20s Sunday and Monday before potentially reaching the teens by Tuesday.
New England pipeline operators were bracing for weather-driven constraints. Iroquois Gas Transmission put out a notice Friday that customers would be required “to adhere to their scheduled volumes” beginning with Saturday’s gas day and continuing through Jan. 2. Tennessee Gas Pipeline expanded an operational flow order (OFO) to include all of its Zones 4, 5 and 6 beginning with Tuesday’s gas day. An OFO issued earlier in the month remained in effect for Algonquin Gas Transmission.
AGT Citygate surged $4.64 to average $11.27 Friday, while Tennessee Zone 6 200L similarly jumped $4.76 to average $12.00.
© 2024 Natural Gas Intelligence. All rights reserved.
ISSN © 2577-9877 | ISSN © 1532-1258 |