NatGas Forwards Let Down Last Week By Bearish Storage, Record Production
Despite a decidedly bullish start last week thanks to strong cash markets, natural gas forward prices for October ultimately dropped an average 10 cents from Sept. 15 to 21 as a bearish storage injection and record production put the prompt month under heavy selling pressure, according to NGI’s Forward Look.
Last Monday, it appeared that market bulls were solidly in control as the Nymex October futures contract settled 12 cents higher at $3.146, which was the highest settle for a prompt month contract since May. The gain was largely driven by strength in the cash market as some impressive late-season heat hit the eastern United States.
The next two days of trading featured modest pullbacks amid a return to pre-Harvey production levels, but last Thursday brought about a one-two punch that sent October futures plunging nearly 15 cents to settle back below $3 at $2.946. November fell 14.2 cents to $3.007.
For one, the market digested news that Lower 48 production last Wednesday had been revised up to 74.6 Bcf/d, an all-time record.
One day later, the U.S. Energy Information Administration (EIA) reported a 97 Bcf injection into storage inventories for the week ending Sept. 15, about 6 Bcf above market consensus. Last year, 54 Bcf was injected into storage and the five-year average stands at 73 Bcf. Inventories are now at 3,408 Bcf, 136 Bcf less than last year and 67 Bcf greater than the five-year average.
Despite the dramatic sell-off following the storage report, it seems most market experts agree there are enough supportive fundamentals at play to lead to a rebound in prices.
“We believe this week’s EIA print was a rather one-off looser number due to the power outages we saw across Florida from Irma. We continue to see near-term heat support cash prices, which traded far above prompt-month prices through the day today (Thursday), and we see risks for heating demand to get going in early October that would further support prices. Though today’s large move in prices certainly appears concerning for bulls, this market remains tight enough for us to see this as a potential gift for those wanting long exposure,” Jacob Meisel, chief weather analyst at Bespoke Weather Services, said last Thursday.
Analysts at Houston-based Mobius Risk Group agreed there could be some upside to prices in the near term. The current week’s storage data (to be reported in the Sept. 28 EIA inventory report) indicates the market is likely to coalesce around a 75 Bcf injection, which would be approximately 1.5 Bcf/d lower than the five-year average, Mobius said. Although this would lead to another large contraction in the deficit to last year, the subsequent four weeks are shaping up to see a minimal gain versus year-ago storage levels, depending on weather.
“Over the past couple of days, there have been cooler shifts in the Northeast for early October, which, if backed out of weather forecasts, would cause prices to remain depressed for the time being,” Mobius said.
Indeed, weather guidance turned a bit less bullish overnight as heating demand looked less impressive in both the medium and long term, Bespoke said. Much of this is due to a ridge building in the Midwest over the medium range that will prevent cold weather in the East from being as significant and ensure that the center of the country warms rather quickly.
“However, even with this, we continue to note that most modeling guidance struggles to get temperatures much back above average, so that heating demand should be rather close to seasonal averages through the beginning of October,” the Harrison, NY-based weather forecaster said.
Meanwhile, Mobius said the market also should keep a close eye on salt dome storage levels in the coming weeks. Thursday’s EIA report was the second straight week that reflected a 19 Bcf injection into salt domes, which is concerning, the company said. There is now 304 Bcf in salt storage, which is 99 Bcf less than last year’s record high posted during the week of Dec. 2.
“Any weekly build in salt storage of greater than 15 Bcf going forward will likely have a noticeable impact on pricing at the front of the curve,” Mobius said.
Yes, But, Will We Make it to March
For those viewing Thursday’s bearish storage figures as a comfortable level of supply ahead of the winter season, analysts at Societe Generale (SocGen) say it is actually the end of the withdrawal season that the market should be more concerned with.
“The end of October storage finish still looks ”safe’, which means that at ~3.8 Tcf, our base case at the moment, should limit the amount of fear of tightness as the market exits the injection season. Our focus actually is almost entirely on the end of March 2018 number as it is the one that looks most vulnerable given the risks in our base-case outlook,” said SocGen’s Breanne Dougherty, natural gas analyst.
Among those risks, she said, are weather and production growth pace. SocGen currently has end-of-March storage level tracking at 1.5 Tcf, which means the company’s 1H2018 looks ”very vulnerable’ to tight optics under anything other than a mild weather scenario and/or material outperformance of production relative to its base-case by February 2018.
With production hovering near all-time highs, SocGen’s trend toward 74.5 Bcf/d by December looks achievable, as does the extension to over 75 Bcf/d by February, Dougherty said.
“Outperformance risk is possible given the recent acceleration of growth, but we continue to see some constraints through 1Q 2018 that we expect to keep growth contained,” she said.
Still, Dougherty cautioned that a 3.8 Tcf start to the traditional withdrawal season does not provide the same degree of winter cushion that it once did, due to demand expansion over the last few years. “From a “days cover” perspective (end-of-month storage vs. that month’s average demand), the market will be over 5 Bcf/d tighter than the five-year average for the start of winter 17/18.”
Looking more closely at the futures and forward markets, prices were down across the curve but some pricing locations posted far more substantial declines than the benchmark Henry Hub. Nymex October futures fell 8 cents from Sept. 15 to 21 to reach $2.946, November dropped 8 cents to $3.007 and the winter 2017-2018 strip (November-March) slid 7 cents to $3.19. Smaller declines were seen further out the curve as much of the action this week was centered on the front months.
Price Declines Continue
On a national level, price weakness was even more pronounced as several regions like Appalachia and California posted more significant declines. Forward prices fell an average 10 cents for October, 9 cents for November and 8 cents for winter 2017-2018. Not unlike Nymex futures, smaller changes were seen beyond the coming winter, Forward Look data shows.
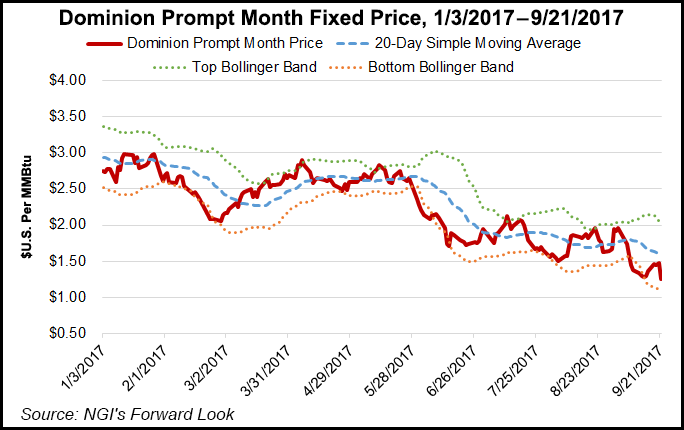
In Appalachia, Dominion South (DomSouth) October forward prices tumbled 14 cents from Sept. 15 to 21 to reach $1.276 as cash prices at the pricing hub saw quite a bit of volatility during the period thanks to the late-season heat wave that swept through the region. DomSouth cash prices moved in a 59-cent range throughout the week, hitting a high of $1.78 on Wednesday before plunging to $1.49 during Thursday’s trading session, according to NGI historical daily indexes.
The rest of the DomSouth forward curve saw much more muted losses as the market appears to be pricing in the additional capacity being brought online in the region in the coming months. Most notable among those projects is Energy Transfer Partners LP’s (ETP) 713-mile, 3.25 Bcf/d Rover Pipeline, which started initial service this month and has been flowing around 700 MMcf/d east-to-west. The pipeline is designed to deliver Marcellus and Utica shale gas to markets in the Midwest, Gulf Coast and Canada.
ETP said this week that it expects the remainder of the project’s Phase 1 to the Midwest Hub in Defiance, OH, to be completed by the fourth quarter, with the project’s Phase 2 on track for completion by the end of 1Q2018.
To help keep tabs on the evolving Marcellus/Utica shale takeaway picture as Rover ramps up to its full 3.25 Bcf/d of designed capacity in the coming months, NGI has debuted a daily Rover Tracker. The Rover Tracker gives an up-to-date snapshot of receipts and deliveries on the project and will continue to expand as new segments enter service.
With the added takeaway capacity, DomSouth November slipped just 4 cents from Sept. 15 to 21 to reach $2.167, an 84-cent discount to the Henry Hub. Winter 2017-2018 prices were down 7 cents to $2.66, but reflected just a 53-cent discount to the Hub. For the next winter (2018-2019), DomSouth sits 38 cents below Henry Hub at $2.76, Forward Look shows.
Other points in the producing region also posted significant losses with the erratic swings in the cash market. At Transco Leidy, October forwards plunged 14 cents from Sept. 15-21 to reach $1.208 as cash prices shot up from $1.05 on Monday to $1.76 Wednesday and then to $1.41 on Thursday.
Meanwhile, November forward prices at Transco Leidy fell just 4 cents to $2.028, and the winter 2017-2018 strip (November-March) dropped 8 cents to $2.48.
Over in the West, cooler temperatures were on tap for the start of fall (Sept. 22) as weather systems bring valley rain and mountain snow showers into early next week. The resulting drop in demand — just weeks after the California power grid operator projected record power loads — sent forward prices tumbling this week, with double-digit declines seen in some areas through the winter.
At Pacific Gas & Electric City-gates, October forward prices slid 15 cents from Sept. 15 -21 to $3.211, November dropped 13 cents to $3.247 and the winter 2017-2018 fell 10 cents to $3.31, according to Forward Look.
Farther north of PG&E, Malin October tumbled 13 cents to $3.636, November dropped 13 cents to $2.712 and the winter 2017-2018 (November-March) slid 10 cents to $2.95.
To the south of PG&E, Southern California Border October forward prices were down 13 cents from Sept. 15-21 to $2.69, November was down 12 cents to $2.773 and the winter 2017-2018 (November-March) was down 8 cents to $3.06, Forward Look shows.
© 2024 Natural Gas Intelligence. All rights reserved.
ISSN © 1532-1231 |