Market Finally Gets The Memo On Tight Storage Picture, Surges 9 Cents On Week
Natural gas forward prices for October rose an average 9 cents from Aug. 25 to 31, with the majority of that gain attributed to tight storage conditions that apparently just came to light for the market following this week’s storage report from the U.S. Energy Information Administration (EIA), according to NGI’s Forward Look.
Nymex futures led the way, trotting along most of the week with gains of less than a nickel. But Thursday’s storage report helped lift the October contract through the stubborn down trendline that’s been in place since late 2016, up nearly 12 cents on the week to $3.04.
The EIA reported a 30 Bcf injection into storage inventories for the week ending Aug. 25, in line with market expectations but 21 Bcf below last year’s same-week injection and 41 Bcf below the five-year average. Inventories are now at 3,155 Bcf, 239 Bcf less than last year at this time and 8 Bcf above the five-year average of 3,147 Bcf.
NGI’sPatrick Rau, director of strategy and commodity research, said that concerns over Hurricane Irma, a category three storm as of Friday morning, and forthcoming cool weather have helped provided some headwinds for gas. Given the massive destruction caused by Hurricane Harvey, traders will be much more on alert with Irma and all subsequent tropical depressions during the weeks ahead, he said.
“The same thing happened after Katrina and Rita (in 2005), and the same thing happened after the polar vortex in 2014. These significant weather events stayed on the minds of traders, and were priced into future months for a while,” Rau said.
Harvey stormed into South Texas as a Category 4 hurricane, dumping upward of 50 inches of rain in some areas affected by the storm. While it’s too soon to assess the damage, Accuweather on Friday increased its prediction for Harvey’s cost to $190 billion, or 1% of total U.S. gross domestic product.
“The economic impact will be felt across the country and for the rest of the year as issues created by the storm will ripple across the country and impact everything from food and gas prices to shipping costs, jobs and more,” said Accuweather founder Joel N. Myers. “The disaster continues, and the extent of human suffering will only increase as flood waters and lack of electricity and basic services puts Houston into third world-like conditions for days or weeks to come.”
Any subsequent storms in the Gulf of Mexico will likely cause more damage than they would have otherwise, now that Harvey has already been through. It’s adding extra risk to the market right now, Rau added.
Not to be outdone, though, breaking through the down trendline that has been a very stubborn level of technical resistance in recent weeks is significant. “It’s as though now that September is off the board, and October is the prompt month, the market is realizing the storage situation may be somewhat bullish going into winter,” Rau said.
The tight storage picture should not come as a surprise. Since the end of April, the surplus versus the five-year average has fallen by 298 Bcf (17.5 Bcf per week), according to Wells Fargo analysts.
But Bespoke Weather Services’ Jacob Meisel, chief weather analyst, said he sees the 30 Bcf injection reported this week as being far tighter on a week-over-week basis and indicating that the market has very limited downside despite bearish weather expectations over the next couple of weeks.
“Weather and technical indicators are now at odds, with prices breaking out significantly higher yesterday and seeming to start an uptrend,” Meisel said.
Indeed, the Nymex October futures contract remained in the black for most of Friday, after briefly falling below $3 but then regaining ground later in the morning. The Nymex October futures contract ultimately settled Friday at $3.070, up 3 cents on the day.
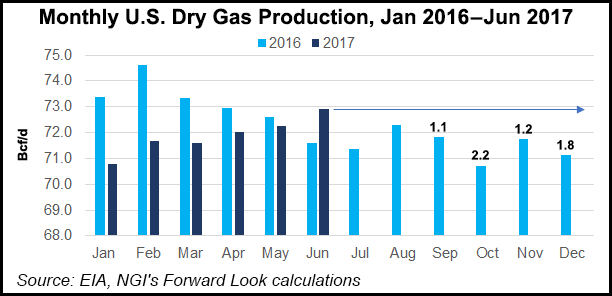
Despite the tight storage picture, the market should also consider production that has grown in recent months and is expected to continue growing for the remainder of the year and into 2018. The EIA on Thursday reported that U.S. dry natural gas production was 2.19 Tcf in June, a 1.9% increase from 2.15 Tcf in June 2016, breaking a series of year-over-year declines dating back to February 2016. It was also the largest monthly y/y percentage increase since November 2015.
If June 2017 dry gas production of 72.9 Bcf/d just stays flat for the rest of the year, then September 2017 production will be 1.1 Bcf/d higher than last year, and October would be 2.2 Bcf/d higher than last year. “That’s ~100 Bcf/d of additional production competing with the y/y storage balance,” Rau said.
November 2017 would be 1.2 Bcf/d higher, and December 2017 1.8 Bcf/d higher, good for 92 Bcf/d of additional production during those two months. “If these hurricanes prove to create lasting demand destruction, then the relative increase in supply only grows from there,” he said.
Meanwhile, North American E&P companies don’t appear to be scaling back their production guidance and in fact, during their 2Q17 earnings calls, companies either reaffirmed their 2017 production guidance, or took it higher, meaning the positive y/y dry gas production growth is likely to continue throughout the second half of 2017, and into winter, Rau said.
“Traders need to keep this in mind when looking at weekly storage injections, since if production is up, the need for storage may not be quite as great, everything else being equal,” he said.
Of course, demand also needs to be considered but can be difficult to project given weather and other variables. In the near term, weather has market bears drooling as demand is expected to drop below normal for much of the week as an unseasonably cool weather system sweeps across the eastern half of the country. The system is expected to lead to comfortable temperatures where highs only reach the upper 60s north to 70s and lower 80s south, according to forecasters at NatGasWeather.
“We still expect a mostly seasonal pattern to set up is after next week as warm high pressure gains ground east of the Rockies, while the western U.S. finally cools. This should bring a return to slightly stronger-than-normal national demand as we approach the core of the second shoulder season,” NatGasWeather said Friday.
The forecaster expects weather conditions to keep storage surpluses stalled below +25 Bcf through the next several weeks, but then resume a gradual decline and likely flip to deficits in late September.
Diving further into the markets, while forward curves ended the week in the black, the strongest increases were seen only as far out as the upcoming winter. The rest of the curve posted more modest gains.
Nymex October futures climbed 11.7 cents from Aug. 25 to 31 to reach $3.041, while November moved up 11 cents to $3.102 and the winter 2017-2018 (November-March) tacked on 9 cents to hit $3.25. The next two seasonal strips were up less than a nickel, but the calendar 2018 rose 5 cents to $3.04.
Forward prices at Dominion appeared to be responding to news that FERC on Thursday authorized Rover Pipeline LLC to place Phase 1A of its project into service, just in time to meet backer Energy Transfer Partners LP’s target for late summer start-up.
While October forward prices at Dominion remained depressed, having shed nearly 5 cents from Aug. 25-31 to $1.91, the rest of the curve posted increases that were in line with Nymex futures and the rest of the country, according to Forward Look.
Dominion November forward prices climbed 9 cents during that time to reach $2.476, winter 2017-2018 (November-March) rose 9 cents to $2.77 and the summer 2018 edged up 4 cents to $2.40.
Analysts have estimated the Phase 1A facilities would add about 211 MMcf/d of capacity out of the constrained Appalachian Basin, with Rover’s Phase 1B, scheduled for service later this year, bumping up total capacity on the project to 1.35 Bcf/d.
Once complete, the $4.2 billion, 710-mile Rover would provide 3.25 Bcf/d of incremental capacity to allow Marcellus and Utica shale production to reach markets in the Midwest, Gulf Coast and Canada.
ETP has said it expects to complete construction on all phases of Rover by late November or early December.
Meanwhile, California markets rallied this week as intense heat continues in the state, sending high temperatures soaring to the 90s and 100s and prompting voluntary energy curtailments on Friday due to what is expected to be record demand.
Indeed, the California ISO said demand was projected to reach 50,860 MW, a level that would breach the previous record of 50,270 MW that was set on July 24, 2006. The ISO’s service territory serves about 80 percent of California’s electricity consumers.
Forward markets were indicative of the strong demand in the state. At PG&E Citygates, October forward prices climbed 14.3 cents from Aug. 25-31 to reach $3.42, November rose 12 cents to $3.437, the winter 2017-2018 (November-March) picked up 11 cents to reach $3.44 and the summer 2018 tacked on just 5 cents to hit $3.07, Forward Look data shows.
At the SoCal Citygates, October forward prices were up 14.1 cents to $3.183, November was up 13 cents to $3.265, the winter 2017-2018 (November-March) strip was up 12 cents to $3.46 and the summer 2018 was up 5 cents to $2.94.
© 2024 Natural Gas Intelligence. All rights reserved.
ISSN © 2577-9915 | ISSN © 2577-9877 |