August NatGas Bidweek Prices Sag As Moderate Temperatures Are Expected
End-of-August bidweek weather forecasts cooled substantially, sending the now spot September futures down sharply. For its part, bidweek quotes came in about a dime lower at most locations.
The NGI National Bidweek Average eased 8 cents to $2.65, but remained a stout 22 cents higher than August 2016’s $2.43 average. All regions failed to make it to the positive side of the trading ledger. Bidweek’s biggest gainer turned out to be Northwest Sumas, with a rise of 20 cents to $2.48, and the largest setbacks were seen in Canada, with Westcoast Station 2 dropping C65 cents to $C1.21/Gj.
Regionally, East Texas fell the most with a 13-cent decline to $2.86, and California on average was flat at $2.95.
South Texas shed 12 cents to $2.87 and South Louisiana lost a dime to $2.89.
The Midcontinent, Southeast, and Northeast all fell 9 cents to $2.65, $2.92, and $2.45, respectively, and the Midwest was quoted 8 cents lower at $2.81.
Appalachia was off 6 cents at $1.85, and the Rocky Mountains fell a penny to $2.58.
August futures settled Thursday at $2.969, down 9.8 cents from the settlement of the July contract, and the spot September contract retreated 8.8 cents to $2.794 during the course of bidweek.
“Our bidweek buying was pretty much normal,” said a Michigan marketer. “It’s not a big month by any means. We bought gas on Consumers and Michcon at 11 and 7 cents under [Nymex settlement], and that put us in the $2.82 to $2.87 range.
“We triggered our deals before settlement as we have been burned enough times when we didn’t do that,” he said.
A Midwest municipal buyer was buying bidweek volumes for storage, and the company was “right on pace for where they wanted to be.” He said the change in the August weather forecast didn’t have much of an impact on bidweek buying.
“When the power generators are bidding into the market they are going off spot purchases, and occasionally on weekends they might get a price drop when industrial load backs off and then they will bid into their power pool,” he said.
“If you don’t have any incentive to do otherwise, you take the safe route,” said a Houston industry veteran. “People with the incentive to call the market price, up or down, might take a bigger [bidweek] position, but not roll the dice and go one way or the other.”
At the end of bidweek, Monday weather forecasts took a sharp turn toward moderation, and the prompt September futures plunged nearly 15 cents, leaving those who did most of their bidweek trading in the lurch when the August contract expired Thursday. “Somebody who made a decision earlier may be on the opposite side of where things may end up going right now,” he said.
As bidweek drew to a close Monday, next-day physical natural gas gained ground with a wide disparity between market zones and producing regions. Stout double-digit gains, with some approaching $1, in the Northeast and Appalachia were easily able to counter broader losses across the Midwest, Midcontinent, Texas, and Louisiana. The NGI National Spot Gas Average added 5 cents to $2.67.
Futures prices headed south, establishing a new five-month low, while the cash market average headed north. A change in the weather models overnight Sunday signaled cooler conditions, and the market opened trading 9 cents lower. At the close on Monday September natural gas had dropped 14.7 cents to $2.794, and October had lost 14.7 cents as well to $2.834. September crude oil gained 46 cents to $50.17/bbl, the first close above $50 in more than two months.
One only had to look at the temperature forecasts for key eastern markets to decipher surging prices along the Eastern Seaboard. AccuWeather.com forecast Boston’s Monday high of 84 would rise to 85 Tuesday and Wednesday, 8 degrees above normal, and New York City’s Monday max of 89 was expected to reach 90 Tuesday before slipping back to 88 Wednesday, 4 degrees above normal.
Gas at the Algonquin Citygate on Monday for Tuesday delivery jumped 82 cents to $2.75, and deliveries to New York City via Transco Zone 6 rose 95 cents to $2.68. Gas on Tetco M-3 Delivery was quoted 27 cents higher at $1.91, and packages on Dominion South added 22 cents to $1.85.
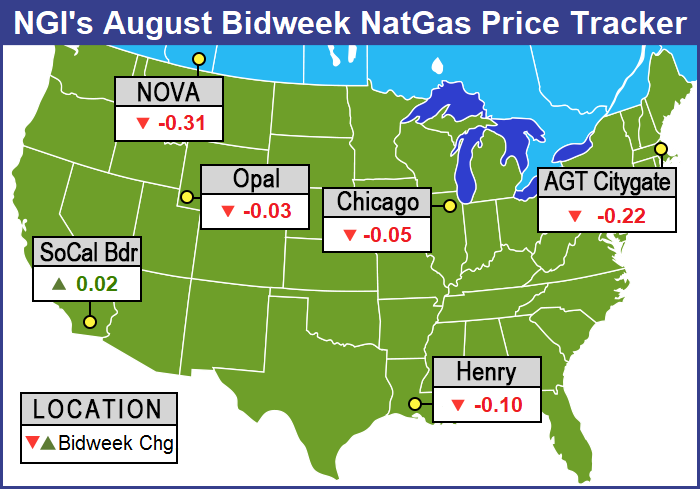
Elsewhere on Monday, gas at the Chicago Citygate was down a penny at $2.78, and packages at the Henry Hub shed 8 cents to $2.84. Gas on El Paso Permian changed hands 2 cents higher at $2.62, and parcels priced at Northern Natural Demarcation shed 2 cents to $2.70.
Kern River fetched $2.67, up 2 cents, and gas at Malin was seen flat at $2.71. Gas priced at the SoCal Border Average rose 31 cents to $3.07, and gas at the SoCal Citygate jumped 35 cents to $3.50.
“The charts are saying we are in the fifth wave of a five-wave Elliott Wave pattern lower,” said PowerHouse LLC Vice President Elaine Levin.
“Some of the technical measurements bring you another 30 cents lower, which would bring you back to the $2.50s, which represent the lows on a continuation chart going back to last September.
“I would caution that December 2017 is $3.09, December 2018 is $3.02 and the following December $2.91. If that were to flatten, it would indicate the bears have something to say,” she said.
September natural gas opened 9 cents lower Monday morning at $2.85 as weather models turned cooler, sending estimated cooling load below seasonal norms. Overnight oil markets were mixed.
Overnight weather models turned sharply cooler. Monday’s “six- to 10-day period forecast is significantly cooler than Friday’s forecast over the majority of the continental United States (CONUS), except the Northwest,” said WSI Corp. in its morning report to clients. “CONUS population-weighted cooling degree days are down 11.5 to 45.5 for the period, which are 7.7 below average.
“Forecast confidence is average as medium range models have come into reasonably good agreement with the development of an amplified pattern and influx of cool air into the eastern two thirds of the CONUS.”‘
ICAP Commodities analyst Scott Shelton expects this week to be “more of what we’ve been seeing lately” with the long range storage surplus taking another hit amidst strong demand.
The Intercontinental Exchange end-of-storage futures market has been active lately, and last Wednesday 200 trades went off between 3,768 and 3,790. “The 3,788-to-3,790 range had a huge cluster of trades around it,” said Shelton. “We note that the range is lower by about 5 Bcf each week for the past few weeks. This is a whopping distance from 4 Tcf.
“Nonetheless, if the weather peters out in the fall, as we think it might, and production remains robust, which we also think is a gimme, we could see one of the beefiest fall injection periods ever. The tally may not hit 4 Tcf, but 3.85 we see as a realistic mark, with record production through the winter.”
DEVO Capital President Mike DeVooght noted that last week the market made a successful test of support at $2.85, and “the gas market was able to rally back to prior week’s settlement levels. On a trading basis, we will hold current hedge positions and will stand aside for speculators.”
Most physical natural gas traders hunkered down last Thursday as they not only had to get deals done concurrent with the expiration of the August Nymex futures contract but also had to keep a watchful eye on the release of storage data by the Energy Information Administration (EIA).
For the week ending July 21, the EIA reported a storage build far below expectations at just 17 Bcf, about 7 Bcf less than what traders were looking for. At the close last Thursday the expired August contract added 4.5 cents to $2.969, and September had risen 5.3 cents to $2.967. September crude oil gained 29 cents to $49.04/bbl, its fourth straight gain for the week.
Before the storage report was released, traders were looking for a higher storage build than the actual figures. Last year 20 Bcf was injected for the week, and the five-year average stood at 47 Bcf.
ION Energy calculated a 21 Bcf injection, and Raymond James and Associates estimated a 32 Bcf build. A Reuters survey of 24 traders and analysts showed an average 24 Bcf with a range of +17 Bcf to +32 Bcf.
“All of a sudden the market popped it up,” said a New York floor trader. “I think you had some shorts in the market against recent lows that were hanging on because there was [only] sideways movement that were spooked out because of the number. If the market can’t make new highs it will slip back, and if it gets under $2.97, traders will push it back to the lows.”
Said Tim Evans of Citi Futures Perspective, “This was a second consecutive bullish miss relative to consensus expectations and supportive relative to the 47 Bcf five-year average for the week ended July 21. While the report doesn’t provide background fundamental data on supply or demand factors, our guess is that this represents a higher rate of power sector consumption than anticipated.”
Wells Fargo Securities LLC analysts said the report was bullish.
“Based on current weather forecasts as well as elevated power burn levels thus far in July (35.8 Bcf/d month to date), our model projects a 48 Bcf cumulative storage build over the next two weeks. This would be substantially below the five-year average of 100 Bcf and would reduce the storage surplus to just 66 Bcf by the first week of August.”
Inventories now stand at 2,990 Bcf and are 302 Bcf less than last year and 111 Bcf above the five-year average.
© 2024 Natural Gas Intelligence. All rights reserved.
ISSN © 1532-1258 | ISSN © 2577-9877 |