Markets | NGI All News Access | NGI Data
Physical NatGas, Futures Race Each Other Higher; June Adds 8 Cents
Physical traders typically try to get their Thursday deals done ahead of the release of Energy Information Administration (EIA) inventory figures. Oftentimes this will lead to disparate outcomes in the physical and futures markets as the 10:30 a.m. EDT report will prompt wide moves in the futures.
This time around the physical traders must have been clairvoyant, for the cash and futures markets both registered healthy gains, with strong moves higher in the Midwest and Midcontinent outdistancing weaker pricing in the Northeast and Appalachia.
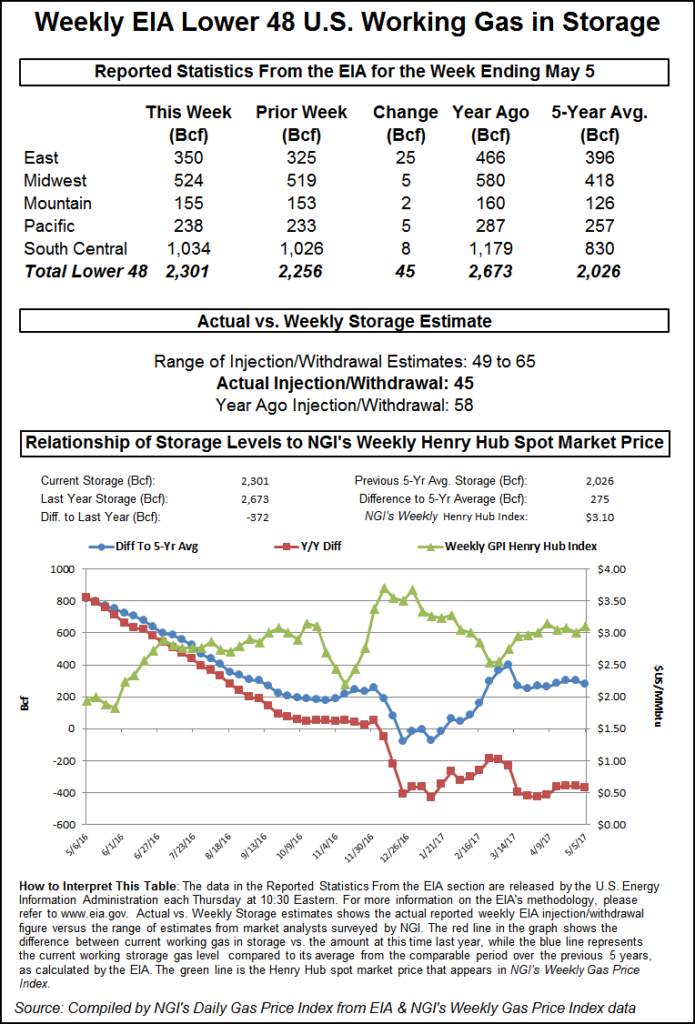
The EIA reported a storage build of just 45 Bcf, about 8 Bcf less than expected, and futures prices romped higher. The NGI National Spot Gas Average gained a nickel to $3.04 and at the close June had added 8.4 cents to $3.376 and July was up 8.1 cents to $3.461. June crude oil gained 50 cents to $47.83/bbl.
Once the 45 Bcf had rattled across trading desks, June futures rose to $3.387, and at 10:45 a.m. EDT June was trading at $3.372, up 8.0 cents from Wednesday’s settlement.
Prior to the report, traders were looking for a storage build well below historical norms, but the 45 Bcf figure was beyond expectations. Last year 58 Bcf was injected and the five-year average stands at a stout 73 Bcf.
Tradition Energy was looking for a 55 Bcf increase, and Stephen Smith Energy had calculated a build of 50 Bcf. A Reuters survey of 23 traders and analysts showed a sample mean of 53 Bcf with a range of +49 to +65 Bcf.
“We were looking for a number in the mid-50 Bcf range,” said a New York floor trader. “Initial technical resistance was $3.35 so it broke through that, and if it settles above $3.35, that would be a good indication.
“The 45 Bcf build for last week was below the consensus expectation for 53-54 Bcf and also below the 73 Bcf five-year average for the date, a clear bullish surprise,” said Tim Evans of Citi Futures Perspective. “The data implies some tightening of the market and the end of a mini-run of bearish surprises.”
Some see not only tightening but an undersupplied market. “This week marked the first data point since the start of shoulder season where temperatures were comparable to both the 5-yr average and last year, and the clear read-through from this week is that the natural gas market is meaningfully undersupplied,” said the Wells Fargo Securities analytical team in Denver.
“The 45 Bcf injection was 22 Bcf below the 5-yr average, 11 Bcf below last year and 10 Bcf below consensus estimates. Heating degree days [HDD] for the week came in at 56, in-line the 5-yr average and below last year’s 68. The week ended 5/12/17 has seen cooler than normal temperatures thus far and the NOAA’s forecast next week calls for above average temperatures across the eastern U.S. Therefore our forecasted cumulative injection for the next 2 weeks is just 120 Bcf, 57 Bcf below the 5-yr average of 177 Bcf and 24 Bcf below last year’s 144 Bcf.”
Inventories now stand at 2,301 Bcf and are 372 Bcf less than last year and 275 Bcf greater than the five-year average. In the East Region 25 Bcf was injected, and the Midwest Region saw inventories rise by 5 Bcf. Stocks in the Mountain Region were increased by 2 Bcf and the Pacific Region was up 5 Bcf. The South Central Region increased by 8 Bcf.
Next week’s storage figures may be on the lean side as well. The National Weather Service (NWS) forecasts above normal heating loads for Midwest and eastern energy markets. For the week ended May 13 NWS sees New England at 86 HDD, or 13 above normal. The Mid-Atlantic is expected to see 86 HDDs also, or 26 above normal. The greater Midwest from Ohio to Wisconsin is predicted to experience 79 HDDs, 14 more than its normal seasonal tally.
Overnight weather models turned warmer. MDA Weather Services in its morning 11- to 15-day outlook said, “Coming out of the warmer 6-10 day period, this period likewise features warmer adjustments and focused from the Midwest to the East in the early half. Above normal temperatures remain the favored solution along the southern tier and the East Coast, with much aboves preceding a storm system in the East in the early half.
“This broad warm look to the pattern is supported by the longer term +AMO [Atlantic Multidecadal Oscillation] signal but also with negative trends in the PNA [Pacific North American Index] and +SOI [Southern Oscillation Index]. There remains uncertainty within the details of this warm regime, most notably along the northern tier between the American and European models.”
In the physical market prices firmed as power burns were within a whisker of the highest levels yet this year. According to industry consultant Genscape power burns have gradually increased to season-to-date highs and are approaching year-to-date highs, but still lag last year same-date levels.
Midwest and producing zone points outdid eastern locations. Gas at the Algonquin Citygate was up a cent to $3.18 and deliveries to Dominion South came flat at $2.88. Gas at the Chicago Citygate rose 4 cents to $3.12 and Henry Hub was quoted at $3.20, up 9 cents.
Northern Natural Demarcation was see 6 cents higher at $3.00, Opal rose 8 cents to $2.89, and gas priced at the PG&E Citygate rose 6 cents to $3.48.
[Subscriber Notice Regarding NGI’s Market-Leading Natural Gas Price Indexes]
Genscape said that its “proprietary estimate (a hybrid of our proprietary monitored data combined with select pipeline nominations) for [Thursday] has Lower 48 burn at 25.29 Bcf/d, just a tick below yesterday’s observed at 25.4 Bcf/d. Yesterday’s value (though subject to revision upon incorporation of no-notice data) is the highest since March 15 and the sixth highest of the year-to-date.
“Recent upticks are driven by increased burns in EIA East and South Central regions. Yet, despite current levels reaching season-to-date highs they still lag last year same-date burns by roughly 2.3 Bcf/d. This is primarily a function of modestly cooler temperatures this year and strong renewables generation outweighing the incremental gas burns from a heavy nuke outage season.”
This time around the physical traders must have been clairvoyant, for the cash and futures markets both registered healthy gains, with strong moves higher in the Midwest and Midcontinent outdistancing weaker pricing in the Northeast and Appalachia.
The EIA reported a storage build of just 45 Bcf, about 8 Bcf less than expected, and futures prices romped higher. The NGI National Spot Gas Average gained a nickel to $3.04 and at the close June had added 8.4 cents to $3.376 and July was up 8.1 cents to $3.461. June crude oil gained 50 cents to $47.83/bbl.
Once the 45 Bcf had rattled across trading desks, June futures rose to $3.387, and at 10:45 a.m. EDT June was trading at $3.372, up 8.0 cents from Wednesday’s settlement.
Prior to the report, traders were looking for a storage build well below historical norms, but the 45 Bcf figure was beyond expectations. Last year 58 Bcf was injected and the five-year average stands at a stout 73 Bcf.
Tradition Energy was looking for a 55 Bcf increase, and Stephen Smith Energy had calculated a build of 50 Bcf. A Reuters survey of 23 traders and analysts showed a sample mean of 53 Bcf with a range of +49 to +65 Bcf.
“We were looking for a number in the mid-50 Bcf range,” said a New York floor trader. “Initial technical resistance was $3.35 so it broke through that, and if it settles above $3.35, that would be a good indication.
“The 45 Bcf build for last week was below the consensus expectation for 53-54 Bcf and also below the 73 Bcf five-year average for the date, a clear bullish surprise,” said Tim Evans of Citi Futures Perspective. “The data implies some tightening of the market and the end of a mini-run of bearish surprises.”
Some see not only tightening but an undersupplied market. “This week marked the first data point since the start of shoulder season where temperatures were comparable to both the 5-yr average and last year, and the clear read-through from this week is that the natural gas market is meaningfully undersupplied,” said the Wells Fargo Securities analytical team in Denver.
“The 45 Bcf injection was 22 Bcf below the 5-yr average, 11 Bcf below last year and 10 Bcf below consensus estimates. Heating degree days [HDD] for the week came in at 56, in-line the 5-yr average and below last year’s 68. The week ended 5/12/17 has seen cooler than normal temperatures thus far and the NOAA’s forecast next week calls for above average temperatures across the eastern U.S. Therefore our forecasted cumulative injection for the next 2 weeks is just 120 Bcf, 57 Bcf below the 5-yr average of 177 Bcf and 24 Bcf below last year’s 144 Bcf.”
Inventories now stand at 2,301 Bcf and are 372 Bcf less than last year and 275 Bcf greater than the five-year average. In the East Region 25 Bcf was injected, and the Midwest Region saw inventories rise by 5 Bcf. Stocks in the Mountain Region were increased by 2 Bcf and the Pacific Region was up 5 Bcf. The South Central Region increased by 8 Bcf.
Next week’s storage figures may be on the lean side as well. The National Weather Service (NWS) forecasts above normal heating loads for Midwest and eastern energy markets. For the week ended May 13 NWS sees New England at 86 HDD, or 13 above normal. The Mid-Atlantic is expected to see 86 HDDs also, or 26 above normal. The greater Midwest from Ohio to Wisconsin is predicted to experience 79 HDDs, 14 more than its normal seasonal tally.
Overnight weather models turned warmer. MDA Weather Services in its morning 11- to 15-day outlook said, “Coming out of the warmer 6-10 day period, this period likewise features warmer adjustments and focused from the Midwest to the East in the early half. Above normal temperatures remain the favored solution along the southern tier and the East Coast, with much aboves preceding a storm system in the East in the early half.
“This broad warm look to the pattern is supported by the longer term +AMO [Atlantic Multidecadal Oscillation] signal but also with negative trends in the PNA [Pacific North American Index] and +SOI [Southern Oscillation Index]. There remains uncertainty within the details of this warm regime, most notably along the northern tier between the American and European models.”
In the physical market prices firmed as power burns were within a whisker of the highest levels yet this year. According to industry consultant Genscape power burns have gradually increased to season-to-date highs and are approaching year-to-date highs, but still lag last year same-date levels.
Midwest and producing zone points outdid eastern locations. Gas at the Algonquin Citygate was up a cent to $3.18 and deliveries to Dominion South came flat at $2.88. Gas at the Chicago Citygate rose 4 cents to $3.12 and Henry Hub was quoted at $3.20, up 9 cents.
Northern Natural Demarcation was see 6 cents higher at $3.00, Opal rose 8 cents to $2.89, and gas priced at the PG&E Citygate rose 6 cents to $3.48.
[Subscriber Notice Regarding NGI’s Market-Leading Natural Gas Price Indexes]
Genscape said that its “proprietary estimate (a hybrid of our proprietary monitored data combined with select pipeline nominations) for [Thursday] has Lower 48 burn at 25.29 Bcf/d, just a tick below yesterday’s observed at 25.4 Bcf/d. Yesterday’s value (though subject to revision upon incorporation of no-notice data) is the highest since March 15 and the sixth highest of the year-to-date.
“Recent upticks are driven by increased burns in EIA East and South Central regions. Yet, despite current levels reaching season-to-date highs they still lag last year same-date burns by roughly 2.3 Bcf/d. This is primarily a function of modestly cooler temperatures this year and strong renewables generation outweighing the incremental gas burns from a heavy nuke outage season.”
© 2024 Natural Gas Intelligence. All rights reserved.
ISSN © 1532-1231 | ISSN © 2577-9877 |