Utica Shale | E&P | NGI All News Access | NGI The Weekly Gas Market Report
Ohio NatGas Output Climbed, While Oil Production Fell Last Year
Combined year/year conventional and unconventional oil production in Ohio slid 19% in 2016, reflecting the shift to dry gas production, which increased by 44% during the same time, according to estimates compiled by members of the Ohio Oil and Gas Association (OOGA) for the annual Debrosse Memorial Report.
The report — unveiled last week at OOGA’s winter meeting in Columbus — offers a comprehensive analysis of the industry’s operations in the state each year. It’s compiled using public information. With only three quarters of 2016 data released by the state, the final production figures are estimates.
Combined oil production dropped to 20.6 million bbl in 2016 from a record of 25.5 million bbl in 2015. Unconventional production — primarily from the Utica Shale — accounted for 17.5 million bbl of 2016 oil production. Combined natural gas production, however, went from about 1 Tcf in 2015 to more than 1.4 Tcf last year, according to the report. The Utica Shale accounted for nearly all natural gas production in the state last year, producing 1.397 Tcf.
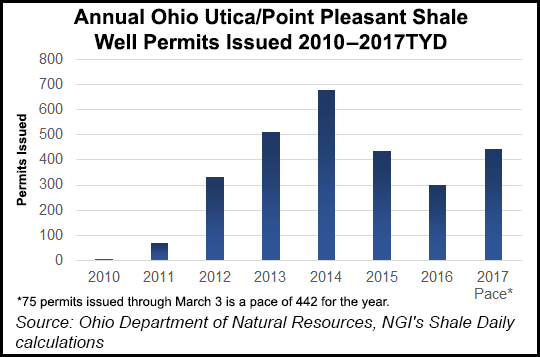
The rest of the report showed the mixed bag that 2016 was for the state’s natural gas producers. They dealt with the commodities downturn for most of the year before prices started to inch upward and the outlook improved. Drilling permits continued to fall from a peak of 1,659 in 2014 to 561 last year, according to the report, which said 997 permits were issued in 2015. Completions increased 16% year/year, however, reaching 620 last year — 77% of which were horizontal completions.
Producers finished 466 Utica wells, seven Marcellus Shale wells and two horizontal Clinton Sandstone wells. Belmont, Harrison and Monroe counties were the top three respectively for completions, accounting for 309 of them. Operators reported completions in 36 of 88 counties. The top 12 counties accounted for 90% of all the wells in the state, according to the report.
The state’s shale producers continued to drive up footage drilled. The report said operators drilled eight million feet in 2016 compared to 6.6 million in 2015 and 2.2 million in 2010, one year before the state reported its first commercial Utica Shale production.
There were 71 companies producing oil and gas in Ohio last year, compared to 87 in 2015. The report shows that more than 275,000 oil and gas wells have been drilled in Ohio since 1860. There’s more than 50,000 producing wells in 49 of Ohio’s 88 counties.
© 2024 Natural Gas Intelligence. All rights reserved.
ISSN © 2577-9877 | ISSN © 1532-1266 | ISSN © 2158-8023 |