Markets | NGI All News Access | NGI Data
NatGas Cash, Futures Race Lower as EIA Stats Seen to Be Bearish
Traders will typically try to get their physical deals done before the 10:30 a.m EST release of natural gas storage data by the Energy Information Administration (EIA), and for a moment Thursday it looked as if the next-day traders may have jumped the gun.
The physical market racked up broad double-digit losses from the Northeast to Appalachia, the Midwest, Midcontinent and Rockies, yet prior to the release of the EIA data, March futures were down only about a penny at $2.914. The physical traders, ultimately, were proven correct, and by the close spot futures had put in lows not seen since November. The NGI National Spot Gas Average tumbled 13 cents to $2.70, and futures finished the day with their own set of bumps and bruises. At the close March had fallen 7.1 cents to $2.854 and April had retreated 6.6 cents to $2.971. March crude oil added 25 cents to $52.36/bbl.
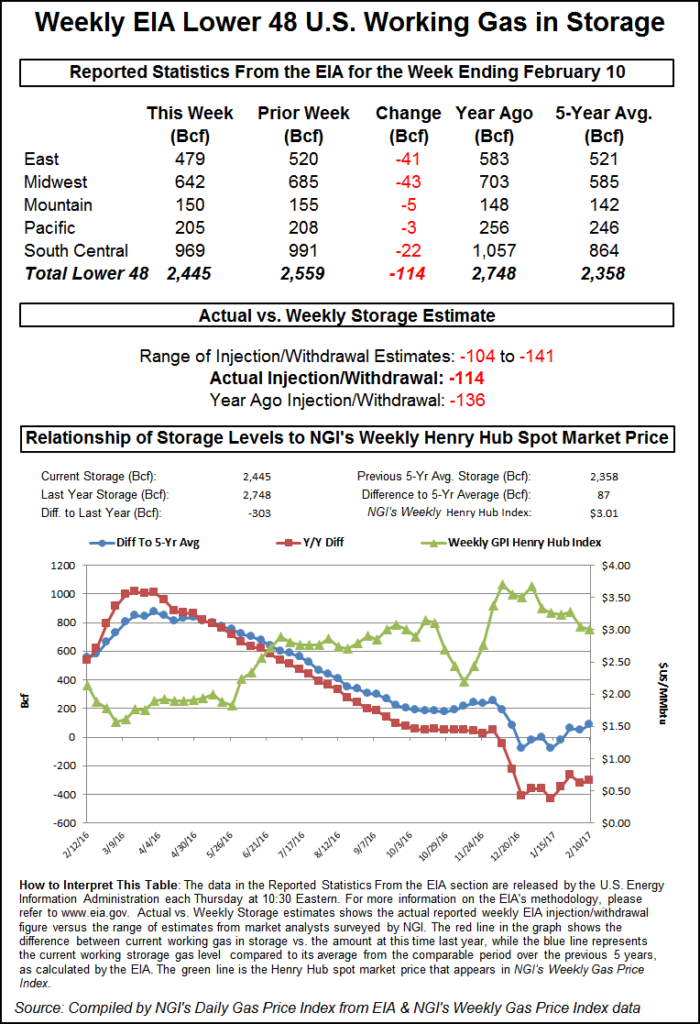
The release of storage data proved to be the day’s big surprise as industry estimates proved to be way wide of the mark. The EIA reported a storage withdrawal that was significantly less than what traders were expecting. The EIA reported a 114 Bcf storage withdrawal for the week ending Feb. 10, about 10 Bcf less than industry estimates. March futures traded down to $2.865, and by 10:45 a.m. the contract was trading at $2.886, down 3.9 cents from Wednesday’s settlement.
Traders were somewhat surprised initially that the market didn’t fall further. “It looks like it wants to hold here,” said a New York floor trader. “I’m thinking that since it didn’t break under $2.86 it is a sign it wants to work better.” That, however, proved premature.
“The net withdrawal of 114 Bcf was a clear bearish miss compared with the 124 Bcf consensus expectation, implying a weakening of the background supply-demand balance,” said Tim Evans of Citi Futures Perspective. “The draw was also bearish compared with the 156 Bcf five-year average decline.”
Harrison, NY-based Bespoke Weather Services said, “There may be enough bullish weather risk for prices to hold on, but this number certainly tilts risk back to the downside as the market loosens.”
Inventories now stand at 2,445 Bcf and are 303 Bcf less than last year and 87 Bcf greater than the five-year average. In the East Region 41 Bcf was withdrawn, and the Midwest Region saw inventories decrease by 43 Bcf. Stocks in the Mountain Region fell 5 Bcf, and the Pacific Region was down 3 Bcf. The South Central Region dropped 22 Bcf.
Last year 136 Bcf was withdrawn for the week, and the five-year pace was a 156 Bcf pull.
Weather and storage for this year and last year have been joined at the hip, and weather as measured by heating degree days (HDD) shows a relationship to ending storage inventories. Although the winter of 2016-2017 doesn’t look quite as bad as that of 2015-2016, the current departures from HDD norms are showing a perilous comparison to that of early 2016, when spot futures bottomed in March at $1.611 and storage bottomed at a plump 2,468 Bcf.

Overnight weather models turned warmer once again. “The latest six-10 day period forecast is even warmer than [Wednesday’s] forecast across the eastern and northern U.S.,” said WSI Corp. in a Thursday morning report to clients. “However, there are some colder revisions over the Rockies and Plains late. CONUS GWHDDs are down another three and are only 78.3 for the period. These are 48.9 below average.
“The forecast is already on the warm side of the model guidance, but there are still minor warmer risks over the Plains, Midwest and the East in advance of a storm system. The West and north-central states have some cooler potential late.”
Wednesday’s modest two-cent advance was not enough to convince market technicians schooled in Elliott Wave and retracement analysis that a turnaround is in the cards anytime soon.
“Yes, $2.887 [Tuesday’s low] was able to provide support on Wednesday,” said Brian LaRose, a market analyst with United ICAP. “What is lacking, though, is the violent acceleration higher typically associated with the conclusion of a descending triangle.
“If the bulls cannot step up to the plate and generate a reversal into the end of the week, $2.803 (0.500), $2.701 (“a”=”c”), even $2.598 ((A)=(C)) all become viable near-term downside targets,” he said in a closing report Wednesday.
In the physical market one point followed by NGI did make it to the win column, and a couple of points were unchanged, but the Northeast led the charge lower with losses in the half-dollar range. Gas at the Algonquin Citygate fell 47 cents to $3.55, and gas at Iroquois, Waddington skidded 17 cents to $3.20. Deliveries to Tenn Zone 6 200L were quoted 29 cents lower at $3.73.
Gas on Tetco M-3 changed hands 18 cents lower at $2.67, and parcels bound for New York City on Transco Zone 6 fell 40 cents to $2.71.
Gas at the Chicago Citygate came in 3 cents lower at $2.81, and deliveries to the Henry Hub lost a dime to $2.82. Gas on El Paso Permian shed 13 cents to $2.55, and packages destined for Opal lost 13 cents as well to $2.58. Gas priced at the SoCal Citygate fell 3 cents to $3.02.
© 2024 Natural Gas Intelligence. All rights reserved.
ISSN © 1532-1231 | ISSN © 2577-9877 |