Markets | NGI All News Access | NGI Data
NatGas Cash, Futures Head in Opposite Directions; February Drops A Dime
Physical natural gas for Friday and Saturday delivery traded higher Thursday morning as traders scurried to get their deals done before the release of the Energy Information Administration (EIA) storage report.
Gains in producing zones, such as Texas, Louisiana and the Midcontinent offset losses in the Midwest and Appalachia and the NGI National Spot Gas Average added 6 cents to $3.67.
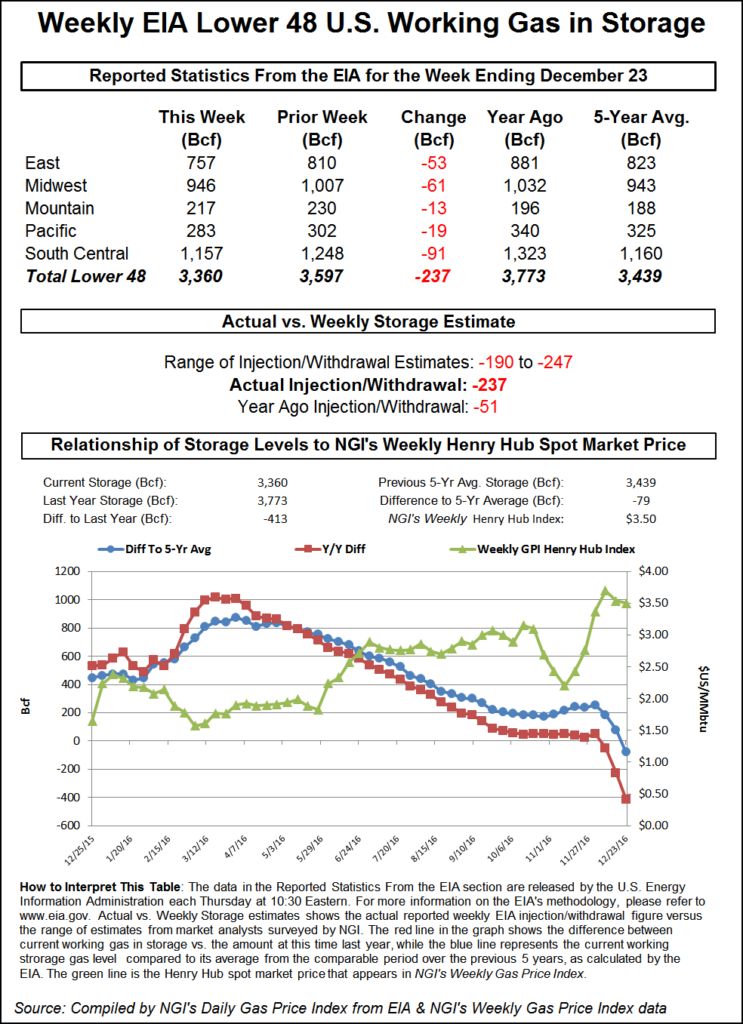
A seemingly bullish EIA storage report had just the opposite effect on the futures screen as the EIA reported a withdrawal of 237 Bcf for the week ending Dec. 23, the highest yet this season and light years ahead of historical averages. Futures put in a half-hearted rally once the figures were released, but at the close February had fallen 9.6 cents to $3.802 and March was down 7.1 cents to $3.754. February crude oil eased 29 cents to $53.77/bbl.
Even though this week’s draw report dwarfed last year’s 51 Bcf withdrawal and a five-year average of 80 Bcf, it didn’t seem to matter.
Traders were expecting a pull about 15 Bcf less than the reported 237 Bcf, and February futures reached a high of $3.884 immediately after the figures were released, but by 10:45 a.m. February was trading at $3.828, down 7.0 cents from Wednesday’s settlement.
“We were looking for between a 220 to 225 Bcf draw,” said a New York floor trader. “Apparently traders thought it would be a lower number because it rallied after the number came out but came back to where it was before the number came out. $4 is going to be a big, big resistance number. If you look straight across the board, you don’t see any $4 prints.”
The two most recent storage pulls have analysts tweaking their spreadsheets. “The 237 Bcf net withdrawal from storage for last week was in the upper half of the range of expectations, a somewhat bullish surprise,” said Tim Evans of Citi Futures Perspective. “The draw for last week was well above our weather-based model’s 198 Bcf estimate, suggesting some combination of greater demand sensitivity to cold than anticipated and some drop in production or net trade supply. Either way, this will shift our baseline for upcoming reports in a bullish direction.”
Inventories now stand at 3,360 Bcf and are 413 Bcf less than last year and 79 Bcf less than the five-year average. In the East Region 53 Bcf was withdrawn and the Midwest Region saw inventories decrease by 61 Bcf. Stocks in the Mountain Region fell 13 Bcf, and the Pacific Region was down 19 Bcf. The South Central Region declined 91 Bcf.
In physical gas trading for Friday and Saturday delivery, New England quotes came in higher, and Mid-Atlantic spot prices were mixed as near-term temperature forecasts called for near-normal levels. AccuWeather.com reported that New York City’s 46-degree high Thursday would slide to 42 Friday and 40 by Saturday, 1 degree above normal. Chicago’s frostier 35 Thursday high was seen easing to 33 Friday but rising to 41 on Saturday, 9 degrees above normal.
Gas deliveries at the Algonquin Citygate added 22 cents to $5.59, and deliveries to Iroquois, Waddington gained 2 cents to $4.86. Packages on Tenn Zone 6 200L rose 66 cents to $6.18.
Gas on Texas Eastern M-3, Delivery was quoted a penny lower at $3.40, and packages headed for New York City on Transco Zone 6 added 29 cents to $4.03.
Marcellus prices eased. Gas on Dominion South shed a penny to $3.21, and gas priced at Tennessee Zn 4 Marcellus fell 13 cents to $3.11. Gas on Transco-Leidy Line shed 8 cents to $3.15.
Major trading centers, however, firmed. Gas at the Chicago Citygate added 4 cents to $3.64, and gas at the Henry Hub changed hands 2 cents higher at $3.68. Gas on Panhandle Eastern added a stout 14 cents to $3.52, and gas at the PG&E Citygate was up 11 cents to $3.98.
Physical gas trading on Friday will be for January delivery Sunday through Tuesday January 3.
Analysts remain optimistic for Q1 pricing. “With weather-adjusted balances tight and weather uncertainty high, heightened volatility is to be expected,” said PIRA Energy in a report Tuesday. “Headwinds loom in the form of more challenging year-on-year weather comparisons in January, but the prospect for prices to reach new highs in 1Q17 remains high.”
Weather models continue to call for not only one invasion of cold air, but also a second incursion in about two weeks. “The coldest period over the next two weeks is now sitting on the fence between the six-10 day and 11-15 day periods,” said Matt Rogers, president of Commodity Weather Group in its morning report to clients. “From day eight Thru to day 11 Sun of next week, we should have an impressive coast-to-coast colder than normal pattern situation. Those days also straddle two different EIA periods.
“During this time, cold could be impressive in many locations, but it is rare to get such broad geographic coverage (missing only mainly Florida). The models then debate the degree of moderation by the middle 11-15 day as they set up for a re-load situation. We show some modest re-warming for especially South and East during the middle 11-15 day and then start sending down cold chunk number two into the Midwest/Plains by late period. High latitude blocking indications, including a strengthening negative Western Pacific Oscillation, supports a second surge of colder weather into the Midcontinent by late period.”
© 2024 Natural Gas Intelligence. All rights reserved.
ISSN © 1532-1231 | ISSN © 2577-9877 |