NGI Data | Markets | NGI All News Access
Natural Gas Price Gains and Losses Offset As October Bidweek Unchanged
At first glance it appeared that double-digit bidweek gains in producing regions from California and the Rocky Mountains to Texas and Louisiana might put a positive luster on October bidweek. However, steep declines in Appalachia and the Northeast offset any hope to a positive outcome and the NGI National Bidweek Average came in at $2.51, unchanged from September, and 15 cents higher than October 2015 bidweek.
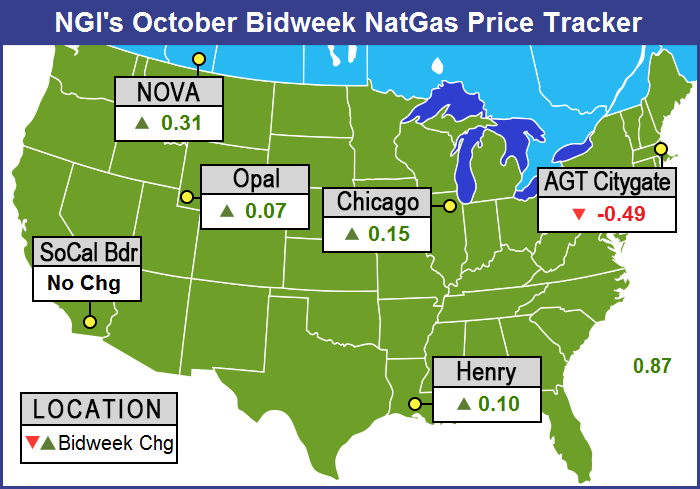
Of the actively traded points, the greatest U.S. bidweek gainer was Chicago Citygate with a rise of 15 cents to $2.96, and the greatest losers were at Algonquin Citygate and Transco Zone 6 NY with declines of 49 cents and 32 cents to average $2.20 and $1.16, respectively. Regionally, Appalachia and the Northeast found themselves at the bottom with losses of 29 cents and 36 cents respectively to $1.11 and $1.58, as traders continued to factor in shoulder season conditions.
All other regions were in the plus column. California added 7 cents to $2.95 and the Rocky Mountains and Midwest were up 9 cents to $2.69, and $2.91, respectively.
South Louisiana added 10 cents to $2.90, the Midcontinent improved 12 cents to $2.77 and East Texas and South Texas each rose 12 cents to $2.90. The Southeast came out on top of the leaderboard with a 16-cent gain to $2.97.
October futures expired at $2.952, 9.9 cents higher than the September settlement.
With mild temperatures forecast through the middle of October, there were some indications that buyers might be tempted to scale back bidweek purchases and test the spot market.
For the month of October, initial heating and cooling load data from the National Weather Service indicated that might not be a bad idea at all. For the week ended Oct. 8, total degree day accumulations for New England, the Mid-Atlantic and greater Midwest were expected to be far below seasonal norms. New England was expected to see a combined heating degree-day and cooling degree-day count of 53, or 27 less than normal. New York, New Jersey, and Pennsylvania were predicted to see a mild 29 degree-day total, or 38 below their normal accumulation, and the greater Midwest from Ohio to Wisconsin was forecast to see 35 degree-days or 36 below normal.
“It’s all a function of demand or a lack thereof at this point,” said a Houston-based industry veteran. “I would say that might be a safe bet. If I were a buyer I might want to scale back, buy a little less, and take my chances it’s not going to go shooting up or anything. It may just stay mild all month.”
“Toward November it typically cools down, but you would think you wouldn’t have to pay too much for it.”
For others who tied their purchases to the expiration of the October futures, they had to pay close to $3, generally more than they paid for September gas whose futures expired about 10 cents less.
“We had negative bases for our bid week purchases,” said a Michigan marketer. “We had one purchase that was a negative 2.75 cents and another that was a negative 2 cents. On Michcon, we had a negative 4.5 cents. At least that was going in the right direction.”
Going forward, the 800-pound gorilla in the room is what the weather will be like for November through March, and will residential and commercial (res/comm) demand be great enough to make a dent in currently more-than-ample, if not burdensome, supplies.
To answer that question, analysts Kevin Adler and Robert Applegate of PointLogic Energy constructed three scenarios on varying levels of res/comm demand to see what ending inventories might be spring 2017, and if that would indicate a rebalanced market.
“To accurately project gas demand in the winter, getting the Res-Com number right is crucial,” they said. “That’s why PointLogic uses a 330-city temperature model to get accurate, granular information that we feed into our model for how gas demand in different parts of the country reacts to temperature variations.”
Their worst case scenario was for a repeat of winter 2015-16. “From Oct. 1, 2015, through March 31, 2016, Res-Com demand averaged 32.6 Bcf, or a total of 4,917 Bcf for the five-month (151 days) period. The average over the last eight years, including last winter, was 36.6 Bcf/d. To put it another way, over the typical 151-day winter season (or 152 days during a leap year), Res-Com demand on average for the last eight years was about 604 Bcf higher than it was last winter. That figure represents drawdown of inventories that would happen in a typical year but did not occur last winter.” That case, 32.6 Bcf/d, results in ending inventories at 2,372 Bcf, not far off March 2016 at 2,467 Bcf.
Using their model and incorporating normal weather and temperature assumptions of the eight-year average they found this would result in res/comm demand of 36.8 Bcf/d, almost 13% greater than the worst case. This calculates to an end-of-March inventory level of 1,698 Bcf.
A third case, mid-point between the two, showed 34.7 Bcf/d res/comm demand and came to an ending inventory of 2,054 Bcf.
Res/comm predictions are useful, but PointLogic admits it cannot predict the weather, and “recent history suggests that temperatures are on the rise — and this is a risk factor that should be taken into account. According to NASA’s Goddard Institute for Space Studies, August 2016 marked the 11th month in a row when worldwide temperatures set a record. These are record temperatures each month, not merely temperatures above average. September looks like it will continue the trend, at least in the U.S.”
As bidweek came to a close Friday, the daily market had morphed into three separate ones. Physical gas outside Appalachia and the Southeast, Physical gas within Appalachia and the Southeast, and the futures. In typical shoulder season fashion, with mild weather expected, no one wants to commit to three-day deals, and points outside sections of the transportation-starved Northeast experienced double digit declines. However, along Transco Zones 5 and 6, Tennessee Zones 4 , 5 and 6, and Texas Eastern market zones 2 and 3, declines of 30 cents close to $1 were common with new all time lows the norm at several points. Some points traded as low as a dime. Futures got off relatively easy, with November sliding a relatively modest 5.3 cents to $2.906 and December giving up 2.9 cents to $3.132. November crude oil rose 41 cents to $48.24/bbl.
It wasn’t difficult to determine why buyers were on the sidelines. Weekend and Monday temperatures across major energy markets were expected to be right at moderate seasonal norms with load-killing rain thrown in as well. Boston, New York, and Chicago were all expected to see ongoing rain along with seasonal temperatures. Boston’s Friday high of 59 degrees was expected to fall to 57 Saturday before making it back up to 65 on Monday, 2 degrees below the seasonal norm. New York City’s high on Friday of 61 was seen rising to 65 Saturday and making it to 72 by Monday, 2 degrees above normal. Chicago’s relatively toasty high Friday of 65 was expected to reach 67 on Saturday and 68 by Monday, 1 degree below normal.
In New England, several points experienced declines approaching $1. Gas on Algonquin Citygate dropped 88 cents to $1.37 and deliveries to Iroquois Waddington shed 78 cents to $1.53. Gas on Tennessee Zone 6 200 L fell 69 cents to $1.35.
“Persistent downpours will raise the flood risk in part of the Mid-Atlantic into Friday night, while rain will spread over the rest of the northeastern United States into the weekend,” said AccuWeather.com’s Alex Sosnowski.
“While the cool and rainy weather into this weekend will have people reaching for jackets and sweaters, some may need to keep an eye on streets and basements for flooding. Highs will mainly range from the lower 60s F to the middle 70s into this weekend. However, the combination of wind, rain and other conditions will cause [wind chill] temperatures to be in the 40s and 50s at times.”
Numerous points set all time low spot prices on Friday for weekend and Monday delivery. Dominion South traded at 29 cents, down 37 cents and 30 cents below its all time low. Tennessee Zone 4 Marcellus changed hands at 31 cents, down 31 cents and a nickel less than its all time low. Gas on Tetco M-3 Delivery was seen at 37 cents, down 28 cents and 28 cents under its all time low. Gas bound for New York City on Transco Zone 6 was quoted at 38 cents, down 31 cents and 31 cents below its all time low.
Major market centers didn’t endure quite the devastation of Appalachia and the Northeast. Gas at the Chicago Citygate fell 19 cents to $2.67 and deliveries to the Henry Hub were seen 11 cents lower at $2.84. Gas on Panhandle Eastern changed hands at $2.60, down 8 cents and Transwestern San Juan was seen at $2.57, down 11 cents. Deliveries to the SoCal Citygate shed 18 cents to $2.74.
In spite of the day’s broad retreat in physical and futures, analysts see limited downside. “With last year’s supply peak now appearing out of reach, the bearish impact of a large supply has been muted and we see significantly more upside risk than downside from current levels,” said Jim Ritterbusch of Ritterbusch and Associates in a morning report to clients.
“And while physical pricing has declined seasonally this week, we believe that downside follow through will prove limited as non-weather related factors dampen additional spot price weakness. We continue to cite recent strength in the spread curve, and although the November-December differential is showing some topping tendencies, we feel that the next major storm event into the GOM will strengthen gas structure in facilitating another upward price advance.”
Gas buyers across the MISO footprint having to purchase incremental supplies for power generation over the weekend aren’t expected to have a lot of wind generation to offset gas purchases. WSI Corp., in a Friday morning forecast said, “Surface low pressure associated with a broad upper-level low over the Ohio Valley will lead to variable cloud cover, widely scattered showers, breezy and cool conditions across eastern areas during the next couple of days. Otherwise, weak high pressure will promote fair weather.
“Temperatures will vary in the 60s, 70s and 80s, warmest across Entergy. High pressure will nose in behind this system during Sunday into early next week. This should result in partly sunny and a warming trend. High temps may rebound into the 70s and 80s. Relatively light wind generation is expected today into the weekend. Output is forecast to drop down to 2-5 GW. A developing southerly wind will cause wind gen to ramp up late Sunday into early next week. Output is forecast to top out 8-9+ GW late Tuesday.”
Thursday’s trading saw futures bulls treated to storage data that came in leaner than expected, but what the bulls quickly found out was that the market that giveth can quickly taketh away. The EIA reported a build of 49 Bcf, about 6 Bcf less than expectations, and prices initially rose, but by the end of the day the screen was solidly in the red. The November contract Thursday shed 4.3 cents to $2.959 and December was off 3.8 cents to $3.161.
As soon as the storage report rumbled across trading desks, November futures reached a high of $3.032 immediately after the figures were released but by 10:45 a.m. November was trading at $2.993 down nine-tenths of a cent from Wednesday’s settlement.
“We were trading $2.99 when the number came out, and it’s ‘now you see it, now you don’t,'” said a New York floor trader describing the market’s momentary move after the release of EIA storage figures.
“$3 is the pivot point which we need to stay above for a few days to generate any upward momentum. I’m not getting much in the way of a bullish vibe.”
“We were looking for a build of 55 Bcf and it came in a little less but the market still came off,” a trader told NGI. “That’s a failure and that’s not good. There’s a little support at $2.88 to $2.89, but not much. Look to the downside. It could get down to the $2.60s.”
“The number indicates slight tightening on a week-over-week basis and has helped support prices, but expectations of a larger injection next week may limit upside above $3 through the day today,” said Harrison, NY-based Bespoke Weather Services.
Inventories now stand at 3,600 Bcf and are 90 Bcf greater than last year and 220 Bcf more than the five-year average. In the East Region, 23 Bcf were injected, and the Midwest Region saw inventories increase by 29 Bcf. Stocks in the Mountain Region rose 3 Bcf, and the Pacific Region was unchanged. The South Central Region decreased 6 Bcf.
© 2024 Natural Gas Intelligence. All rights reserved.
ISSN © 1532-1258 | ISSN © 2577-9877 |