NGI The Weekly Gas Market Report | E&P | Markets | NGI All News Access
U.S. NatGas Pipelines to Mexico Set Another Export Record in June
For the second consecutive month, the United States in June sent the most natural gas to Mexico through pipelines of any month on record, reaching 105.84 Bcf (3.53 Bcf/d), according to Energy Information Administration (EIA) data.
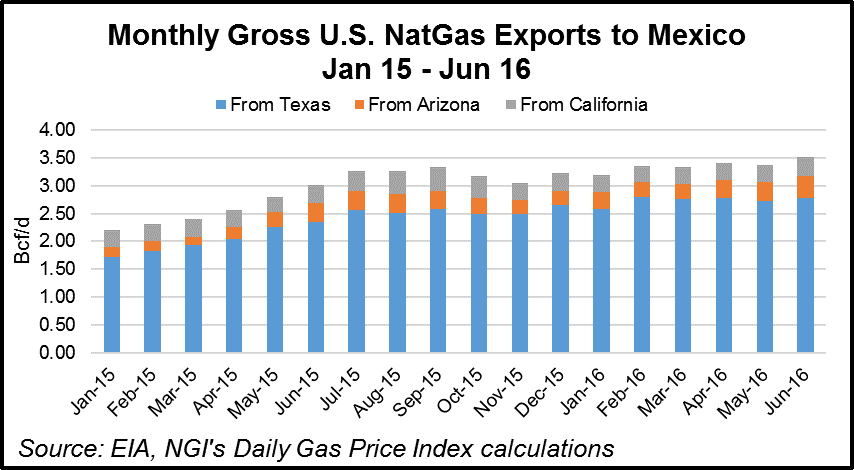
The previous record high was set just a month earlier at 104.70 Bcf (3.38 Bcf/d) (see Daily GPI, Aug. 2). June 2016 pipeline exports to Mexico were significantly higher than June 2015 (90.72 Bcf, or 3.02 Bcf/d), according to EIA’s latest Natural Gas Monthly report.
Total U.S. natural gas exports in June were 173.00 Bcf, a 25% increase from 138.18 in June 2015, according to the report. Pipeline exports to Canada reached 50.71 Bcf (1.69 Bcf/d) in June, compared with 44.66 Bcf (1.49 Bcf/d) at the same time last year, and total liquefied natural gas (LNG) exports were 16.45 Bcf in June, compared with 2.77 Bcf in June 2015.
EIA reported 8.16 Bcf of LNG delivered by ship to Argentina, 4.64 Bcf to Chile, 3.62 Bcf to India and 2 MMcf to Barbados, with another 22 MMcf trucked to Mexico in June.
At the same time, U.S. natural gas imports also increased. Total imports in June were 241.16 Bcf, compared with 206.27 Bcf in June 2015. Most of that increase came through pipeline imports from Canada, which hit 233.42 Bcf, compared with 203.58 Bcf in June 2015. LNG imports also increased, to 7.64 Bcf in June compared with 2.60 Bcf a year earlier. Net imports in June were 68 Bcf, EIA said.
Also for the second consecutive month, U.S. natural gas production and dry gas production in June declined slightly compared with the same month last year, while gas consumption edged higher, according to EIA (see Daily GPI, Aug. 1).
Total U.S. natural gas production in June was 2.63 Tcf (88 Bcf/d), down from 2.67 Tcf (89 Bcf/d) in June 2015, and dry gas production reached 2.17 Tcf (72 Bcf/d), compared with 2.22 (74 Bcf/d) in June 2015.
But total production (16.40 Tcf) and dry gas production (13.41 Tcf) through the first six months of 2016 still outpaced the first six months of 2015 (16.26 Tcf, 13.34 Tcf) and 2014 (15.34 Tcf, 12.42 Tcf), EIA said. Several production records were set last year, and the 2015 total ballooned to 27.09 Tcf, a 5.3% increase compared with 25.73 Tcf in 2014 (see Daily GPI, March 1).
Total production increased compared to June 2015 in only four states: Alaska (233.79 Bcf, compared with 223.02 Bcf in June 2015), Colorado (136.54 Bcf, compared with 136.44 Bcf), Ohio (115.20 Bcf, compared with 84.69 Bcf) and Pennsylvania (434.35 Bcf, compared with 372.18 Bcf).
The lengthy list of states reporting production decreases in June compared with the same month last year included Arkansas (67.29 Bcf, compared with 84.41), California (17.27 Bcf, compared with 17.88 Bcf), Kansas (20.55 Bcf, compared with 24.46 Bcf), Louisiana (151.25 Bcf, compared with 154.21 Bcf), Montana (4.28 Bcf, compared with 4.78 Bcf), New Mexico (106.44 Bcf, compared with 107.36 Bcf), North Dakota (48.56 Bcf, compared with 49.17 Bcf), Oklahoma (201.67 Bcf, compared with 211.08 Bcf), Texas (671.98 Bcf, compared with 731.10 Bcf), Utah (29.95 Bcf, compared with 36.71 Bcf), West Virginia (103.18 Bcf, compared with 113.60 Bcf) and Wyoming (145.31 Bcf, compared with 158.80 Bcf).
The Federal Gulf of Mexico (100.40 Bcf, compared with 111.47 Bcf) and EIA’s Other States category (45.99 Bcf, compared with 49.84 Bcf) also reported declines.
Consumption of dry natural gas in June was 2.03 Tcf (67.7 Bcf/d), a 5.7% increase compared with 1.92 Tcf in June 2015. The 14.32 Tcf total for the first six months of 2016, however, remains below the total for the first six months of 2015 (14.51 Tcf) and 2014.
© 2024 Natural Gas Intelligence. All rights reserved.
ISSN © 1532-1231 | ISSN © 2577-9877 | ISSN © 1532-1266 |