NGI Weekly Gas Price Index | Markets | NGI All News Access
Weekly NatGas Unchanged As Traders Grapple With Unusual Summer Storage ‘Fill’
Weekly natural gas prices drew to a tie for the week ending August 5 as stout gains in the traditional producing basins of Texas, Louisiana, Rockies, and Midcontinent were offset by just as stout declines in the Northeast, Southeast, Appalachia and California. At the end of the week the NGI National Weekly Spot Gas Average was unchanged at $2.59.
The market point showing the week’s greatest gain was gas on Northwest Sumas with a 23 cent advance to $2.54 and the location demonstrating the week’s greatest loss was gas bound for New York City on Transco Zone 6 with a drop of 60 cents to average $1.76.
Regionally the Northeast and California showed the largest declines with the Northeast dropping 36 cents to average $2.32 and California shaving off 12 cents to $2.86. The Southeast and Appalachia both shed 6 cents to $2.91 and $1.46, respectively.
The Rockies added 6 cents to $2.63, and South Texas, the Midcontinent, and South Louisiana all came in 8 cents higher at $2.78, $2.69, and $2.79, respectively. East Texas added 9 cents to $2.79 and the Midwest was higher by 9 cents also to $2.77.
September futures finished the week 10.4 cents lower at $2.772, despite having to digest an unseasonal natural gas storage withdrawal.
Traders of physical gas for weekend and Monday delivery Friday must have had one eye on the futures screen as both markets sustained about equal losses. The Daily NGI National Spot Gas Average gave up 7 cents to $2.54 as gains in the Northeast were hopelessly outmatched by losses in the Rockies, California and Southeast. Futures traders seem to be focused on the absolute and elevated level of storage rather than the recent trend of thin injections.
At the close, September had fallen 6.2 cents to $2.772 and October was lower by 6.8 cents to $2.809. The Dow Jones Industrial Average gained 191 points to 18,543 on favorable employment data.
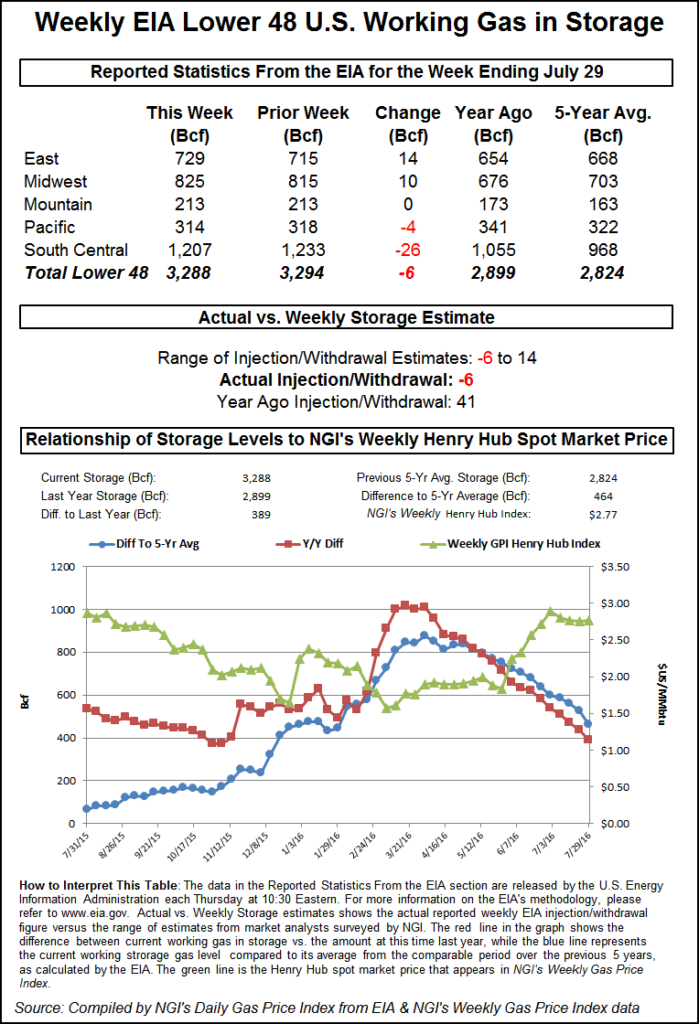
Observers noted that the futures managed to retreat following Thursday’s extraordinary summer storage withdrawal. The U.S. Energy Information Administration (EIA) reported a 6 Bcf withdrawal for the week ending July 29, which NGI calculations found was only the third time since 1994 that the U.S. has experienced a weekly withdrawal during the June, July, and August summer months. The other two occasions were both in 2006: a 7 Bcf withdrawal for the week ended July 21, and a 12 Bcf withdrawal for the week ended Aug. 4.
“Right now it looks like the market is focused on the level of storage rather than the injections,” said Tom Saal, vice president at FCStone Latin America LLC in Miami. “The market is considering the weekly storage numbers as only temporary and is looking forward to when shoulder season builds will become greater.
“We are talking about September here and at that point the worst [warmest] weather is likely behind us. I do think that if storage ends the season where it did last year and we continue with high power burns, it will be bullish for the market. Right now it’s a touchy situation and the market is just treading water.”
The Thursday storage report from a fundamental standpoint demonstrated just how conflicted the market is. Despite the rareness of the event, the 6 Bcf storage withdrawal at the end of the day elicited only a half-cent move lower in September futures to $2.834.
Some were surprised by the market following the report. “It was really kind of shocking. It really surprised me the market’s reaction,” said Steve Blair, Vice President at Rafferty and Co. “We surged higher, but now we are trading lower on the day.”
“The 6 Bcf net withdrawal from natural gas storage for last week was the first summer draw since August 2006,”said Tim Evans of Citi Futures Perspective. “The result was bullish relative to consensus expectations for a 2-3 Bcf net injection and in comparison with the 54-Bcf five-year average build for the date. The report also extends the recent string of bullish storage misses, tending to confirm that power sector demand has been more sensitive to summer heat than anticipated.”
Others weren’t quite so surprised. “The ICE Swap was trading -4 Bcf to -6 Bcf just before the number came out, so it was already in the market,” a New York floor trader told NGI.
Inventories now stand at 3,288 Bcf and are 389 Bcf greater than last year and 464 Bcf more than the five-year average. In the East Region 14 Bcf injected, and the Midwest Region saw inventories grow by 10 Bcf. Stocks in the Mountain Region were unchanged and the Pacific region was down 4 Bcf. The typically opaque South Central Region fell a stout 26 Bcf.
Even with the anomalous 6 Bcf pull, inventories stand at 3,288 Bcf, nearly as high as ever for this point in the injection season. Trouble is that it is not growing fast enough for those who earlier forecast that ending stocks might reach upwards of 4 Tcf, set a new record as well as provide an ample supply cushion and keep prices in check.
Last year supplies set a record at 3,953 Bcf at the end of October, and this year the EIA is projecting ending supplies at 4,022 Bcf.
Analysts find themselves tweaking their forecasts as prices rise. “The largest revisions to the forecast based on recent gas price gains have been to production and power burn. The production projection was revised upward to capture the higher prices available, as well as revisions to rig counts coming in higher than expected. Power burn for winter was revised down from previous forecast as higher gas prices nudge gas out of some regional stacks,” said Eric Fell, a Genscape analyst.
Farther down the road, however, imbalances start to appear.”Our March 2018 storage outlook remains below the low end of the range that we believe that the market would deem acceptable as a normal weather scenario.”
“No change,” said Brian LaRose, a market technician with United ICAP. “Bulls need to lift natgas over $3 to revive the up trend. Bears need to push natgas beneath the $2.625-2.591 lows to make a case for a deeper retreat. As long as natgas remains rangebound we are stuck in a holding pattern. Looking for a pop to $3.190 minimum if the bulls can get through resistance. Looking for a drop to $2.500-2.468 minimum if the bears can take out support,” he said in closing comments Thursday.
The lack of market follow-through seems to have ended the patience of some market bulls. “It…appears that some long position holders are throwing in the towel following [Thursday’s] lack of upside price response to what appeared to be a bullish EIA storage figure,” said Jim Ritterbusch of Ritterbusch and Associates in a Friday morning report to clients. “The withdrawal of 6 Bcf…accelerated the contraction in the supply surplus against five-year averages by a whopping 60 Bcf. This dynamic of a reduction in the surplus will be furthered again next week by an additional surplus decline of as much as 30-40 Bcf that would cut the overhang to as low as 425 Bcf. While this is still a large supply excess in absolute terms, the rate of change (second derivative) is still an important bullish consideration that will be limiting downside price follow-through.”
Another factor likely to diminish downside price risk is increasing exports of natural gas. The United States exported 104.63 Bcf (3.38 Bcf/d) to Mexico through pipelines in May, the most of any month on record and a 21% increase compared with 86.81 Bcf (2.80 Bcf/d) exported in May 2015, according to Energy Information Administration (EIA) data.
While exports to Mexico set a record, almost all U.S. gas exports were up. Overall, U.S. natural gas exports were up 32% in May at 177.28 Bcf compared with 134.27 Bcf in May 2015, according to EIA.
Besides Mexico, exports to Canada, Chile and Kuwait combined to increase exports of LNG.
“On the flip side, we will reiterate that upside price possibilities will remain restricted by the bearish influence of a sizable storage surplus that exists amidst rising production that could emanate from this summer’s upswing in the rig counts. The rise in the oil rigs now appears to be translating some leveling in shale production in upping the possibility that associated natural gas production could prove stronger than widely perceived. Unless this factor receives an offset in the form of a major hurricane event into the GOM, the output factor could begin to slow the decline in the surplus.
“Overall, this market still looks like a standoff from our perspective as both the bulls and the bears appear to possess equally strong arguments. In sum, a range bound trade is still anticipated.”
The closely watched employment report from the US Labor Department revealed non-farm payrolls increased by 255,000 during July, well above the 185,000 expected by economists. The unemployment rate remained flat at 4.9%.
In physical trading weekend and Monday gas prices at California points fell as much as any locations as next-day power loads were forecast to decline. CAISO predicted that Friday’s peak load of 35,934 MW would drop to 34,108 MW Saturday.
Gas at Malin fell 6 cents to $2.71, and deliveries to PG&E Citygate lost 3 cents to $3.18. Gas at the SoCal Citygate was quoted 14 cents lower at $2.74, and gas priced at the SoCal Border Avg. Average shed 13 cents to $2.73.
Gas on El Paso S. Mainline/N. Baja fell 10 cents to $2.80 and packages on Kern Delivery were down 15 cents to $2.74.
Other market points softened as well. Gas bound for New York City on Transco Zone 6 lost two cents to $1.53, and deliveries to the Chicago Citygate changed hands at $2.76, down 8 cents. Gas at the Henry Hub fell 4 cents to $2.85, and gas on El Paso Permian skidded 8 cents to $2.64.
© 2024 Natural Gas Intelligence. All rights reserved.
ISSN © 2577-9877 | ISSN © 1532-1258 |