NGI The Weekly Gas Market Report | E&P | Markets
E&P, OFS Sectors Facing Uncertain Recovery as Prices, DUCs, Manpower Weigh
A backlog of drilled but uncompleted (DUC) wells, a lack of manpower, cannibalized oilfield equipment and persistently stagnant commodity prices are expected to weigh on second quarter results for the oil and gas industry as investors await word of a recovery.
In the coming days, oilfield services (OFS) operators and exploration and production (E&P) companies are expected to detail slumping bottom lines with a hint of optimism for the last half of 2016.
The element of unpredictability always is a given in the industry, but uncertainty over the direction of prices and soaring production have been the disruptors. Stay in the know this earnings season with NGI‘s exclusive 2Q16 Earnings Call & Coverage Sheet, which provides a comprehensive and continuously updating list of when oil and gas companies report, and what their results are.
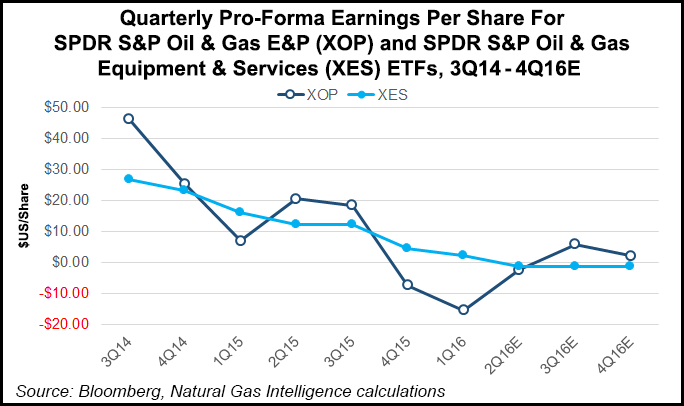
According to calculations by NGI using Bloomberg consensus data, the estimated pro forma diluted earnings for U.S. based E&P and refining companies for 2Q2016, as measured by the SPDR S&P oil and gas exploration and production exchange traded fund (ticker: XOP), are a combined loss of $2.23/share, versus a loss of $15.24/share in 1Q2016 and minus $7.20/share in 4Q2015. In 2Q2015, XOP profits were $20.67/share.
For the OFS sector, pro-forma losses calculated using the SDPR oil services ETF (ticker: XES) on a diluted basis are expected to total $1.17/share in 2Q2016, versus profits of $2.34/share in 1Q2016 and $4.49 in 4Q2015. In 2Q2015, the XES companies combined to earn $12.33 per diluted share.
When West Texas Intermediate (WTI) crude oil prices reached $50/bbl in June and prices appeared sustained, E&Ps began hoisting rigs to target the most promising unconventional areas. In the Permian alone in June, Concho Resources Inc. added seven rigs while Energen Corp. raised six.
June was the “first month to show signs of recovery in the shale rig count over the last two years, with a 5% monthly increase,” according to Rystad Energy. “With higher oil prices expected going forward, it is clear that the rig count has now reached its bottom.”
However, some of the biggest operators in the U.S. onshore still are acting “cautiously before increasing rig activity,” analysts said.
Caution was evident, based on 2Q2016 figures by the American Petroleum Institute (API). U.S. oil well completions between April and June fell by 69% from a year ago while exploratory natural gas completions plummeted 84%. According to API’s quarterly well completion report for 2Q2016, development well footage decreased 53% and exploratory well footage fell by 64%.
The downturn also has sapped the strength of the OFS industry, and there’s little evidence to point to an upturn in the second quarter. OFS revenue overall fell by 16% in 1Q2016 from 4Q2015. A further 10% decline in revenue is predicted for 2Q2016, according to Rystad.
Analysts are a bit optimistic, however.
“This will be the last quarter with double-digit drop, and we may see revenues beginning to increase in 3Q2016 this year,” they said.
Listen for the outlook for DUCs, analysts told NGI’s Shale Daily. See NGI’s recent special report on the topic: Things Still Duc-ky for U.S. E&Ps Bolstered by Uncompleted Wells, Shuttered NatGas.
“Research shows that operators are now starting to complete wells that have previously been put on hold deliberately,” Rystad senior analyst Artem Abramov said. “This comes as more than 90% of the accumulated oil DUC inventory can be commercially completed at a WTI of $50/bbl.”
IHS Markit’s Samir Nangia estimated the U.S. DUC inventory now is around 3,000. Since most of the spending already has been done, DUCs would be the least expensive way to begin work — but they will contribute to more output, he said.
The quarterly conference calls will give investors a better feel about the state of the industry, said BTU Analytics energy analyst Jason Slingsby.
“Production will need to rebound at some point and that means new wells need to come online,” he said. As an example he cited Calgary-based Bankers Petroleum Inc., which earlier this month said it was considering more completions to minimize expenses while still increasing production.
“Considering they had ceased all new well and completion activity at the beginning of 2016, this is a promising sign,” Slingsby said. “DUCs have been the most cost effective way of bringing on new production throughout the downturn, but the backlog in the U.S. has been quickly depleting. Whether any new drilling activity is announced will be a strong indicator of producer health and confidence through price recovery.”
E&Ps also are working only the best acreage today, which requires less expense but steadier output, Nangia said. That means that even if E&Ps concentrate on the DUCs and in the core of the core, they will help their bottom lines and improve reserves.
E&P debt swaps, stock issuance, mergers/acquisitions, and bankruptcies “are expected to continue as the industry prepares for the next cycle,” Slingsby said. “Whether the industry is still healing or ready to begin spending will be a strong theme of 202016 earnings.”
As the Permian Goes…
All eyes are on the biggest of the big, the Permian Basin, said Morgan Stanley & Co. LLC’s Adam Longson. Seventeen of 23 rigs added from June 3 through early July were within the Permian.
“High-grading is another overlooked trend, which suggests the rigs added could have an outsized impact on overall supply,” Longson said. Asset sales and financial offerings likely will be high on the list of investor questions during quarterly conference calls.
“Rising horizontal rigs should change the production profile for 2017,” he said. “While we don’t expect new rigs to change the U.S. production profile in the next few months, a continued ramp in the horizontal rigs could alter the path four to six months out. It’s also important to consider that the rigs are going into the most prolific areas, the decline curve for shale wells is flattening, and completing DUCs could slow declines in as short as one to two months.”
BofA Merrill Lynch Global Research estimated Friday that U.S. shale oil has declined about 800,000 b/d from its March 2015 peak. Shale is responding “faster than other sources of supply, with the output response typically peaking nine to 15 months after a price shock,” analyst Francisco Blanch said.
Most impacted appears to be the Eagle Ford, as it is “possibly the most price-sensitive,” while the Permian appears to be the most resilient to low prices.
Production Down But Still Resilient
Slumping prices have done little to dampen output. Through the downturn, U.S. oil output has barely flinched, with only a 100,000 b/d decline from January to May.
Global oil supply equilibrium is unlikely before 2019, in large part because of U.S. shale drilling, according to Douglas-Westwood Ltd. (DW). Analysts Steve Robertson and Matt Cook shared their insights on Friday in a quarterly global forecast for 2016-2022. DW reviewed data for 64 counties.
Worldwide E&P investments — onshore and offshore — fell 30% last year and should decline another 20% this year, with the onshore hit “the hardest” by far, Robertson said.
Combined with a hiatus in final investment decisions in the offshore, “the impact will be felt through the rest of the decade…”
Low oil prices are expected to persist at least through 2017, with demand overpowered by surging supply. Steady shale output is not the only reason. Large capital investments by E&Ps prior to the 2014 downturn — many in the offshore — now are being completed. That’s going to lead to a large increase in output, which in turn will weigh on prices.
“We need to get through this wave of additional oil supply levels of investment that were made prior to the downturn, and that won’t kick in until 2018,” Robertson said.
For now, U.S. E&PS remain focused on their cash flow, which will continue to drive the direction of capital spend. Since the beginning of 2015, more than 70 energy firms have filed for bankruptcy, nearly half since the start of this year, according to Haynes & Boone LLP.
“In the near term, E&Ps are focused on their free cash flow,” Robertson said. “In the long term, cuts to investment now are going to have an impact on production toward the end of the decade. Excess oil supply will erode, but we won’t have new projects in the pipeline to overcome the decline from existing fields…A new supply crunch could be looming as we approach 2020.”
The recovery may never again approach the halcyon levels prior to the downturn, said DW’s Cook. By 2022, onshore drilling may only be at about 84% of 2014 levels.
“U.S. shale oil drilling is unlikely to return to pre-downturn levels until well into 2020,” depending on how quickly E&Ps begin to return to working outside the core acreage, he said.
This year will be the first since 2009 that global onshore oil production is on the decline, Cook said. While the Organization of the Petroleum Exporting Countries has strategically reduced and raised its output, most of the declines have been because of bankruptcies by U.S. shale operators and spending reductions. And therein lies a warning, as more rigs are raised.
Better-built wells also are making a huge difference in the output figures, said IHS Markit’s Nangia. Producers are drilling less but more strategically in core acreage, where output continues to surge. IHS is estimating that as much as 70% of the pressure pumping equipment is idled in the U.S. onshore. However, with drilling activity focused in the core of the core, output isn’t going to plummet.
During the first six months of this year, drilling activity was centered around wells with the best economics and breakevens of below $40/bbl, Rystad estimated.
“If the oil price remains at the current level of approximately $50/bbl, shale drilling will continue to be mainly in the core plays. In fact, 70% of the shale drilling activity in North America will be concentrated in the top activity plays,” in particular the Bakken and Eagle Ford shales, Permian Basin and Niobrara formation.
Only when oil prices surpass $50/bbl, which could occur in early 2017, drilling activity potentially would start up again outside the main areas.
Manpower, Idle Equipment to Pose Problems
The first half of this year was tough for the OFS operators. The negative trends from 2015 continued as revenues declined, margins weakened and more people lost their jobs.
“Nevertheless, the oil price has gradually increased since it bottomed out in January, indicating a turning tide for the oilfield service industry” over the next six months, according to Rystad.
As the signal gets stronger to raise rigs, the energy industry may have trouble finding people.
Estimates on the number of job losses since 2014 vary. Goldman Sachs puts the number of U.S. jobs lost at more than 170,000. DW estimates the worldwide job losses at about double that number. To date this year, another 7% of the OFS workforce has been laid off, according to Rystad.
“At the moment, more than 350,000 jobs have been lost, and many have left the industry completely,” DW’s Robertson said.
As each rig goes back to work, operators add on average 120-150 people, Goldman noted. If 700 rigs are raised between now and the end of 2018, as Goldman is predicting, the industry would need to add 80,000-100,000 jobs.
Idled, deteriorating equipment also is a looming issue.
“The worst is likely over, but there is little hope for substantial growth in activity or employment before 2017,” said one respondent to a recent Federal Reserve Bank survey in the Dallas district.
© 2024 Natural Gas Intelligence. All rights reserved.
ISSN © 1532-1231 | ISSN © 1532-1266 |