E&P | NGI All News Access | NGI The Weekly Gas Market Report
‘Staggering’ U.S. E&P Reserve Revisions in 2015 Eliminated 40 Tcf, 4.1 Billion Bbl
The 50 largest U.S. producers last year saw their revenues and capital spending plunge, as they attempted to cope in the first full year since 2004 that West Texas Intermediate oil spot prices averaged under $60/bbl, Ernst & Young LLP said.
The firm’s annual U.S. oil and gas reserves study, issued Tuesday in Houston, found that exploration and production (E&P) companies overall reported total capital expenditures in 2015 of $117.5 billion, off 41% from $199.8 billion in 2014. A decline of that magnitude last occurred in 2009 during the global financial crisis. By comparison, spending totaled $166.7 billion in 2013, $180.1 billion in 2012 and $149.8 billion in 2011.
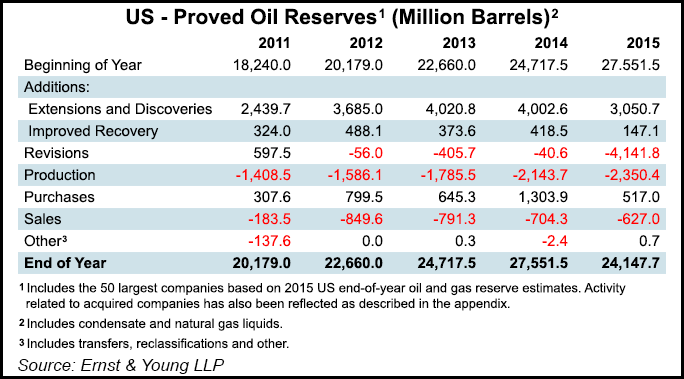
Combined gas and oil production increased 6% year/year, with natural gas output rising 2% to 13.6 Tcf and oil climbing 10% to 2.4 billion bbl. However, “staggering downward reserve revisions” removed 40 Tcf of natural gas and 4.1 billion bbl of oil. End-of-year gas reserves fell 21% to 147 Tcf, while oil reserves declined 12% to 24.1 billion bbl. Additionally, property impairments, including ceiling test charges, were recorded by 44 of the 50 E&Ps and totaled $141.8 billion.
“The significant spending cuts and downward reserve revisions reported in 2015 are illustrative of a structural shift taking place in the industry as a result of abundant oil,” said EY’s Herb Listen, assurance oil and gas leader in the United States. “No longer are capital investment decisions driven by the pursuit of growth; instead the industry and those investing in it are progressively more focused on cash flow and returns.”
The analysis, which represents results from 2011-2015 for the 50 largest publicly traded E&Ps, relied on 2015 year-end reserves estimates for integrateds (8% of the total), large independents (32%) and independents (58%). Based on total reserves at the end of 2015, integrateds held one-quarter (24%), as did independents (25%), with large independents holding about half (51%).
The top gas producers again were led by ExxonMobil Corp. with output of 1.269 Tcf, followed by Chesapeake Energy Corp. (1.079 Tcf), Southwestern Energy Co. (899 Bcf), Anadarko Petroleum Corp. (854 Bcf) and ConocoPhillips (671 Bcf). Reserves-wise, the top U.S. gas producer also was ExxonMobil with 19.6 Tcf, followed by Antero Resources Corp. (9.533 Tcf), EQT Corp. (9.110 Tcf), BP plc (8.362 Tcf) and Cabot Oil & Gas Corp. (7.856 Tcf).
Gas reserve additions in 2015 were overshadowed by 40 Tcf in total downward reserve revisions. Overall, the 50 largest E&Ps posted a minus 152% finding and development (F&D) replacement rate for gas, including revisions. Large independents replaced 132% of their gas output from 2014, while independents replaced 210% and integrateds replaced 88%.
Stagnant commodity prices bit into revenue, which, like spending, fell 41% overall to $129.8 billion. The “all sources” production replacement rate for gas was a minus 192%, and for oil it was minus 45%. For natural gas, proved extensions and discoveries declined 37% from 2014 to 18.7 Tcf. Antero (2.3 Tcf), EQT (2.0 Tcf) and ExxonMobil (1.2 Tcf) posted the largest extensions and discoveries.
“Low natural gas prices over the study period contributed to the study companies recording over 71 Tcf of downward reserve revisions from 2011 through 2015, with a staggering 40.0 Tcf recorded in 2015,” researchers said. “The peer groups were evenly impacted, with each group recording downward revisions equal to about 20% of their beginning-of-year reserves.”
ExxonMobil (6.7 Tcf), Chesapeake (4.2 Tcf) and Southwestern (3.5 Tcf) recorded the largest gas-related downward revisions in 2015 on an absolute basis.
Despite low prices over the study period, gas production steadily increased each year, with the largest gains unsurprisingly by three of the largest Appalachian-focused independents: Southwestern, Antero and EQT. All three posted production of 100 Bcf-plus in 2015.
The large independents also led the way for gas production over the five-year period, with output increasing by one-third from 2011 to 2015, while the integrateds and independents saw declines in production.
WPX Energy Inc. was the leading reserves purchaser in 2015 at $3.2 billion (see Shale Daily,Feb. 9;Jan. 8;Sept. 3, 2015;Aug. 31, 2015). Noble Energy Inc. followed at $3.1 billion (see Shale Daily,May 11, 2015). Other big spenders for proved properties in 2015 were Gulfport Energy Corp., EOG Resources Inc. and EV Energy Partners LP. For unproved properties, top spenders included Southwestern, Devon Energy Corp. and Chevron Corp.
Gas reserves purchases totaled 2.0 Tcf in 2015, led by Noble’s acquisition of 629 Bcf in its takeover of Rosetta Resources. Gas reserves sales last year totaled 7.4 Tcf, with the largest, 1.7 Tcf, included in Repsol SA’s purchase of Talisman Energy Corp. Meanwhile, Anadarko Petroleum Corp. reported it sold about 1 Tcf through transactions related to its East Texas and Rocky Mountain portfolios.
The significant decline in overall revenue for the 50 E&Ps, coupled with substantial property impairments, resulted in net losses totaling $112 billion in 2015. The largest impairments were reported by producers using full-cost accounting, which requires a ceiling test to be conducted each quarter using the 12-month average of the first-day-of-month reference prices. Property impairments, including ceiling test charges, totaled $141.6 billion.
Net losses of the top 50 E&Ps last year totaled $112 billion, with the largest impairments reported by Apache Corp. ($18.2 billion) and Devon ($18 billion). Both of the super independents use full-cost accounting. Full-cost companies accounted for 74% of total impairments reported last year, even though only 28% use that accounting method.
“Amid low prices, declining hedges and the drastic drop in revenues, many U.S. producers are experiencing rating downgrades and lower reserve base borrowing limits and, consequently, less cash flow and liquidity,” said EY’s Mitch Fane, oil and gas transactions leader in the Southwest region. “Already, bankruptcies and restructurings have increased as have dividend and interest payment deferrals. This trend is expected to continue amid lower-for-longer oil.”
Capital spending saw a marked decline across the board in 2015. Amid less merger and acquisition activity, proved acquisition costs fell 79% to $5.4 billion, while unproved acquisition costs slumped 63% to $10.0 billion.
“While many expect an uptick in asset sales due to oil and gas companies’ need for capital, the most valued E&P assets in this current environment are frequently the lifeblood of their companies’ operations,” Fane said. “As a result, the bid-ask spreads for quality, producing properties and declining values of some non-producing properties have hindered transactions and private equity investment thus far.”
Exploration spending declined 28% from 2014 to $17.1 billion from $23.6 billion, while development spending fell 31% — most evident in reduced drilling activity. The number of net exploratory wells drilled declined 41% and was off 31% for development drilling.
“The independents and large independents accounted for the most significant cuts to exploration and development spending, while the integrateds actually increased exploration spending by 9%,” Listen said. “Looking forward to 2016 and 2017, the full range of U.S. producers will face continued pressure to reduce spending if prices remain at current levels.
For the oil majors, exploration spending actually increased overall from 2014 by 9%, lifted by Royal Dutch Shell plc’s activity in the Gulf of Mexico and offshore Alaska. Development-wise, ExxonMobil led the group with spending of $7.185 million, followed by Chevron Corp. at $6.275 million and Shell at $5.72 million.
© 2024 Natural Gas Intelligence. All rights reserved.
ISSN © 2577-9877 | ISSN © 1532-1266 | ISSN © 2158-8023 |