Markets | NGI All News Access | NGI Data
NatGas Cash, Futures Diverge as July Jumps After Thin Storage Build Report
Natural gas for Friday delivery traded in largely uninspired fashion Thursday as traders hunkered down and got deals done prior to the release of inventory data by the Energy Information Administration (EIA).
If you were a buyer, that strategy worked handsomely as most points outside the Northeast drifted lower by a couple of pennies and locations in the East saw a few double-digit losses. The NGI National Spot Gas Average retreated 5 cents to $2.08 and only few points in Texas and the Midcontinent managed to make it to the plus side of the trading ledger.
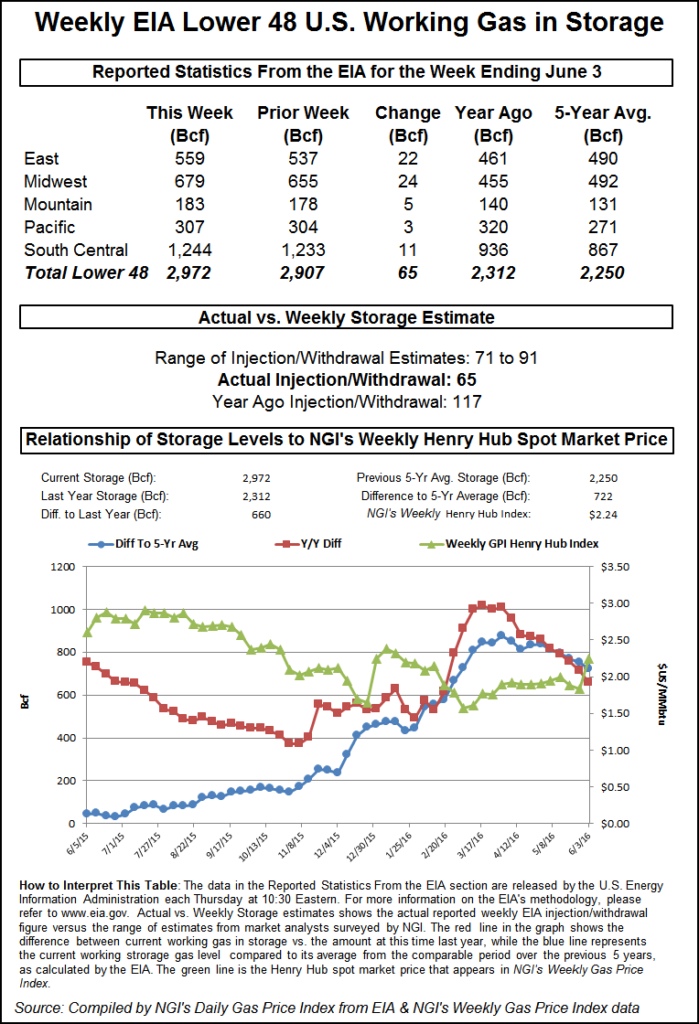
The day’s major price driver was the EIA storage report, and after the EIA figures showing a thin build of 65 Bcf for the week ending June 3, about 13 Bcf less than anticipated, rattled across trading desks, futures traders saw prices in a new regime. At the close, July had added 14.9 cents to $2.617 and August was up a stout 14.6 cents to $2.690. July crude oil was left out of the party and fell 67 cents to $50.56/bbl.
If the trading framework of one trader is correct, prices may be headed significantly higher. “Most of the day’s buying and selling took place after the release of the report and at the high end of the day’s range,” said a trader with FCStone Latin America in Miami. “$2.495 is an important price, and if the market can post a weekly settlement greater than $2.495, the next objective is $3.37.”
Others aren’t so sure. “I think this thing is a little overblown,” said a California trader. “You have to be careful buying the highs here, and there is still plenty of gas.
“The normal range for a nine-day RSI (relative strength indicator) is 20, indicating oversold, and 80, showing overbought conditions. The RSI today is at 83.25. It’s a sale.”
The 65 Bcf came in significantly less than even the lowest estimates by traders and analysts. A Reuters survey of 20 traders and analysts revealed a range from 71 Bcf to as high as 91 Bcf.
Data errors and omissions and the holiday weekend aside, the report raises the question of just how robust natural gas supply is following increased exports to Mexico, newly hatched LNG exports, and a plunging rig count.
Industry consultant Genscape cautiously said, “Preliminary estimates of Lower 48 production show volumes have dipped to a 148-day low, though caution should be used as nomination revisions have been relatively large of late. In the past two weeks, we’ve been seeing total daily nomination revisions ranging from -0.2 Bcf/d up to + 0.4 Bcf/d.
“[Thursday’s] Spring Rock Daily Pipe Production estimate is showing production below 72 Bcf/d for the first time since early January on a 0.67 Bcf/d day-over-day decline,” the company said in a Thursday morning note to clients.
Declines in the East were reported in northeast Pennsylvania, Southwest Pennsylvania and Ohio, but declines were also seen in Texas, the New Mexico Permian, and Gulf of Mexico.
Forecasters are having a difficult time with their weather models. Commodity Weather Group in its Thursday morning six- to 10-day outlook shows above-normal temps from North Dakota to Colorado and from Wyoming to eastern Illinois. “June continues to be a more difficult month to measure as the models continue to oscillate between hotter and cooler changes. Over the past 24 hours, the three major ensemble guidance (European, American, Canadian) sources have all shifted back cooler again, especially toward the Midwest and East,” the company said.
“Slight demand losses are noted with the model consensus, but our outlook holds closer to steady. We have been holding that steadier ground by not warming up as strongly as the models and also not flipping cooler as aggressively.”
The lean injection is also consistent with recent EIA production data. In a report, EIA said marquee producing states such as Ohio, Pennsylvania and West Virginia all registered declines from February to March. Ohio and West Virginia declined by 3% or more month to month and Pennsylvania was down 1.8%.
Production declines are a major factor that additions to storage can’t meet short- and long-term injection averages. Last year, 117 Bcf was injected, and the five-year pace stands at 96 Bcf.
This week’s figures came in sharply lower. JP Morgan calculated a build of 74 Bcf and, Ritterbusch and Associates was looking at an increase of 87 Bcf. A Reuters survey of 20 traders and analysts resulted in an average of 78 Bcf.
Bentek Energy’s flow model figured on a 74 Bcf build but cautioned that “because the storage week contained a holiday, the macro risk to this week’s forecast is likely to a larger injection rather than a smaller one. Week-over-week, the largest changes in storage activity are estimated to have occurred in the East and Pacific EIA regions.”
In physical market activity most major market hubs were down a few pennies. Gas at the Chicago Citygate was quoted a penny lower at $2.25 and deliveries to the Henry Hub fell 2 cents to $2.31. Gas at Opal changed hands 4 cents lower at $2.09, deliveries to the SoCal Citygate were down 2 cents to $2.38, but gas on Dominion South shed a dime to $1.52.
© 2024 Natural Gas Intelligence. All rights reserved.
ISSN © 1532-1231 | ISSN © 2577-9877 |