Markets | NGI All News Access | NGI The Weekly Gas Market Report
No Turnaround Yet For Natural Gas Marketers, NGI Survey Finds
With continuing weak demand and low prices, the downward trend on sales by natural gas marketers extended into its third year as 2016 began, according to NGI’s 1Q2016 Top North American Gas Marketers Ranking, but there may be light at the end of the tunnel.
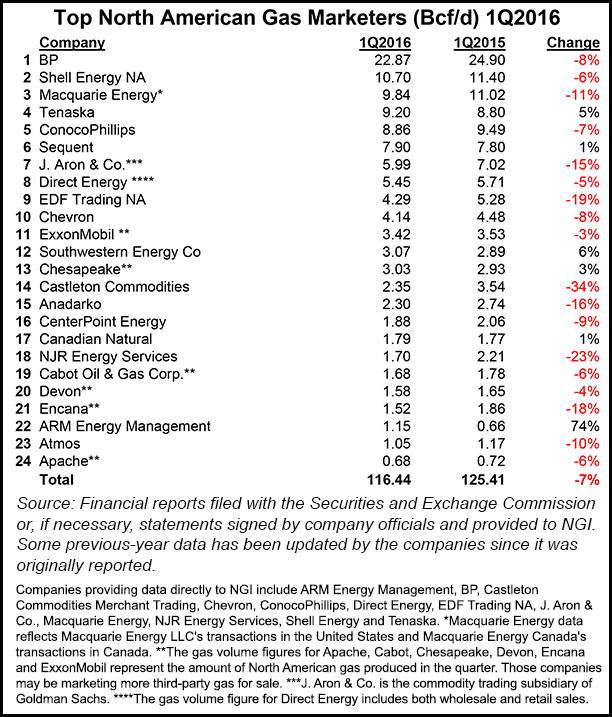
The snapshot of leading gas marketers reported combined sales transactions of 116.44 Bcf/d in 1Q2016, a 7% decline compared with 1Q2015. The full year 2015 was 2% below 2014.
However, there are two developments that may contribute to more U.S. natural gas production in the months ahead, which in turn would likely increase marketed gas volumes, according to Patrick Rau, NGI director of strategy and research. “One is crude oil prices that are now closer to $50 per barrel,” Rau said. “That could get some production going again in the Permian and Eagle Ford basins in particular, and with that, you would have an increase in associated gas production.”
The other factor is a bit more subtle.
“Keep an eye on the status of pipeline projects out of the Marcellus and Utica shales,” Rau said. “Kinder Morgan just cancelled its Northeast Energy Direct project [see Daily GPI, April 21], and I’d be very, very surprised if Constitution Pipeline ever gets built [see Shale Daily, May 16]. Several potential projects that would move gas to the Southeast are facing heavy opposition as well. If those don’t get built, gas into the growing Southeast U.S. market will have to come from other sources with higher breakeven prices. Point being, a lack of supply out of the Appalachia may force U.S. natural gas prices higher, which of course should lead to higher production.”
Rau doesn’t expect an immediate turnaround. Volume declines may continue for the “next several quarters,” he said.
“2016 is more about preserving capital and shoring up balance sheets than it is about growing production. Gone are the days of companies massively leveraging their balance sheets and outspending their cash flow in order to ramp production and prove up reserves, at least for the foreseeable future.”
The U.S. onshore oil and gas drilling rig count has fallen for 38 consecutive weeks, Rau said, and he expects more rigs will be taken out of service in the weeks ahead.
Among marketers there is another trend to watch. While four of the survey’s top five marketers reported lower numbers, it was the mid-level marketers who were picking up speed.
Tenaska, which is celebrating its 25th anniversary as a gas marketer, was the largest of the half dozen marketers able to buck the downward trend, reporting 9.20 Bcf/d, a 5% increase compared with 8.80 Bcf/d in 1Q2015, enough positive news to propel it into the No. 4 spot in the survey, up from No. 5 at the end of 2015.
Other companies reporting increases compared with 1Q2015 were Sequent, which came in at No. 6 with 7.90 Bcfd, up 1% from 7.80 Bcf/d, Southwestern Energy Co. at No. 12 with 3.07 Bcf/d, up 6% from 2.89 Bcf/d, and Chesapeake, No. 13 with 3.03 Bcf/d, up 3% from 2.93 Bcf/d. Further down on the list Canadian Natural came in at No. 17 with 1.79 Bcf/d, up 1% from 1.77 Bcf/d, and ARM Energy Management was No. 21 with 1.15 Bcf/d, up 74% from 0.66 Bcf/d).
NGI‘s survey found declines among the top three companies (see Daily GPI, Dec. 4, 2015), including perennial No. 1 BP plc, which reported 22.87 Bcf/d, an 8% decline compared with 24.90 Bcf/d in 1Q2015. The supermajor recently posted a surprising net profit that upended Wall Street forecasts as lower costs more than offset the impact of weaker commodity prices (see Daily GPI, April 26). CEO Bob Dudley has said he expects the demand for oil to catch up with falling output later this year, easing the glut that has ravaged commodity prices. Market fundamentals “continue to suggest that the combination of robust demand and weak supply growth will move global oil markets closer into balance by the end of the year,” he said last month.
Shell reported 10.70 Bcf/d in 1Q2016, a 6% decline compared with 11.40 Bcf/d in 1Q2015, and Macquarie Energy reported 9.84 Bcf/d in 1Q2016, an 11% decline compared with 11.02 Bcf/d in the same period in 2015. Royal Dutch Shell plc has twice reduced its 2016 capital spending, and warned earlier this month that low natural gas and oil prices are continuing to weigh on executing expansion plans in North America (see Daily GPI, May 4). Low commodity prices are hindering global growth in the near- to medium-term, CFO Simon Henry said.
Also reporting a decline, and subsequently falling from No 4 to No 5 in the survey, was ConocoPhillips, with 8.86 Bcf/d, down 7% compared with 9.49 Bcf/d in 1Q2015. The company has been plagued by significant declines since it implemented business model restructuring in North America following the spin-off of downstream operations four years ago (see Daily GPI, April 17, 2012). Determined to get out of deepwater drilling in the Gulf of Mexico and battered by a $1.5 billion 1Q2016 net loss, ConocoPhillips recently slashed its 2016 capital expenditures budget by $700 million (see Daily GPI, April 29). In a sign of just how grim the commodity price environment has become — and how long it’s expected to last — the Houston-based producer earlier this year cut its quarterly dividend for the first time in at least 25 years (see Shale Daily, Feb. 4).
The NGI survey ranks marketers on sales transactions only. FERC, in its Form 552 tallies both purchases and sales. While production was rising, natural gas trading continued to decline in 2014 compared with 2013, according to an analysis last year by NGI of 2014 Form 552 buyer and seller filings with the Federal Energy Regulatory Commission (see Daily GPI, May 28, 2015). While production has increased, natural gas commodity trading has decreased. Total volumes bought and sold declined for the third consecutive year, reaching 114,603 TBtu, down 3.0% compared with 2013. It was the lowest reported volume total since FERC began publishing Form 552 data six years ago (see Daily GPI, July 6, 2009).
© 2024 Natural Gas Intelligence. All rights reserved.
ISSN © 1532-1231 | ISSN © 2577-9877 | ISSN © 1532-1266 |