E&P | NGI All News Access | NGI The Weekly Gas Market Report
Marginal Costs to Produce Fall Sharply But Higher Oil Price Still Imperative, Bernstein Says
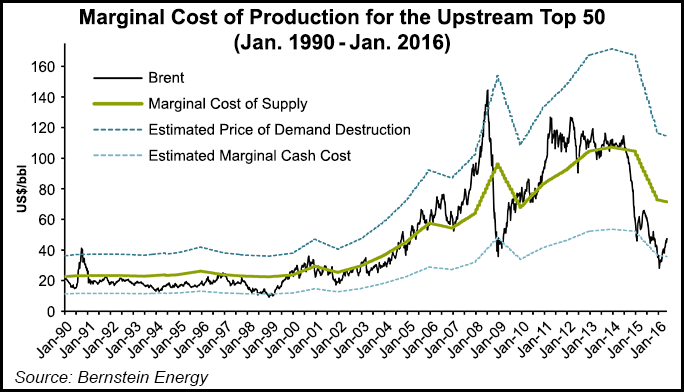
After falling 30% between 2014 and 2015 as oil prices plunged, the marginal cost to produce a barrel of oil could fall again in 2016, but operators overall still need higher commodity prices to breakeven, according to an analysis by Sanford C. Bernstein & Co. of the Top 50 global operators.
Some fields can work with current prices, but it’s not a sustainable way to operate, analyst Neil Beveridge said in a new report that traces the fortunes of the “Top 50” producers in the world, including U.S. independents.
“While costs appear to have ‘peaked’ for the time being, the biggest controversy in the industry is whether technology/shale can drive sustained cost deflation in the industry going forward, thereby reducing costs and prices further,” Beveridge said.
Oil prices usually trade between the marginal cash cost of production and the marginal cost. Over the long run, oil prices likely are going to be set by the marginal cost of production, and that means prices have to move higher for operators to keep working.
“When markets are tight (inventories/spare capacity low and supply-demand in balance), prices should trade at or above the marginal cost; conversely, when markets are oversupplied (inventories/spare capacity high and supply exceeds demand), oil prices should trade down toward the marginal cash cost of production.”
However, costs aren’t static.
To determine where the breakevens are to produce, Bernstein analysts reviewed the cost and profitability trends of the largest producers over the past 15 years to establish the global marginal cost of production. The only companies to be included are not members of the Organization of the Petroleum Exporting Countries (OPEC) or part of the Former Soviet Union (FSU) .
In only one year’s time — from 2014 to 2015 –the marginal cost of the Top 50 fell by 30% to $73/bbl from above $100, representing a compound annual growth rate of 11%. That’s in line with the growth in oil prices over the same period.
“While some of this trend can be accounted for by service industry inflation, it also reflects increasing resource complexity or depletion, which has more than offset improvements in technology,” Beveridge said.
To derive the marginal cost of production, his team reviewed the published financial/annual reports of the Top 50. Global oil prices in general are set by the marginal cost of non-OPEC production — because most OPEC output is low on the cost curve and not sensitive to price. In 2014, that non-OPEC/FSU supply accounted for more than 43% of the world’s oil output, which is the highest cost supply source within the industry.
The largest global operators in terms of total production were determined to be ExxonMobil Corp., PetroChina, Mexico’s Petroleos Mexicanos, BP plc and Royal Dutch Shell plc — nearly all highly leveraged to North America. Fourteen producers were included with production of more than 1 million boe/d, and the Top 50 group accounted for more than 75% of total non-OPEC oil supply.
Producers at the low-end of the cost curve generally were international oil companies (IOC) and national oil companies (NOC), while those at the high end typically had been North American exploration and production (E&P) companies. What Bernstein found is that U.S. E&Ps are performing better than ever.
Surprisingly, the domestic E&Ps’ costs are stabilizing, while inflation has gone up among the IOC/NOCs and Canada’s E&Ps. Among the large caps, IOCs including Shell, ExxonMobil and BP have seen unit costs “in the middle to lower end of the range.” NOCs, which used to be in the lower end of the cost curve, have moved to the higher end, reflecting a focus on growth over costs.
U.S. operator unit costs have reversed, moving from the top end of the cost curve to the lower end as unconventional drilling has improved the economics for some of the larger operators. In contrast, Canadian E&P’s now are “at the top end of the cost curve as a result of their focus on oilsands.”
A cost metric often used in determining production costs is the unit cost, i.e. the breakeven, which includes operating costs/related taxes, exploration expenses and depreciation. Among the Top 50, production-weighted unit costs in 2015 declined by 18% to $34.00/boe. Since realizations for the industry average 68% of oil prices, the breakeven was determined to be $50/boe ($34.00/68 cents).
“Of course, there is elasticity in this number to oil prices (i.e. production taxes will be lower at lower oil prices),” Beveridge said. “While companies are on average close to the breakeven point at current price level of $49/bbl, return on capital at 3% is significantly below the cost of capital. It is hard to see oil prices at current level as sustainable, unless cost deflation in the industry is significant.”
Oil prices fell much more quickly than costs, putting industry margins under pressure. Net income/boe historically moved in the same direction as oil prices, but in 2015, it was nearly wiped out, averaging 7 cents/boe, he said.
“While oil prices dropped by almost 50%, unit costs dropped by a smaller magnitude (minus 18% year/year) resulting in significant margin compression. Net income margins for the Top 50 have dropped from 30% a decade ago to 2% in 2015, which is the lowest in this century. Current margins are now significantly below those during the financial crisis.”
Industry returns also are well below the cost of capital. “In our view current margins are unsustainable,” he said. “We believe prices will have to rise from here.” Bernstein is forecasting prices to recover to $60/bbl by the end of this year as rising demand brings the world markets into balance.
The Federal Reserve Bank’s Ryan Decker, Aaron Flaaen and Maria Tito recently shed some light into why U.S. E&P costs to produce have fallen more than some of their peers worldwide. They noted that simply using costs to determine how and why a producer drills has its limits.
“There is considerable anecdotal evidence that firms may choose to temporarily operate at prices below their costs for a variety of reasons,” they said. “Many firms bought price hedges that have allowed them to continue selling some oil above spot prices, though some of these contracts will expire by the end of 2016. Shut-in costs — the costs of shutting down producing wells — are significant. Some firms may choose to operate below cost to retain market share or a core of skilled workers, to maintain cash flow for debt servicing or dividends, or to avoid losing production rights under certain types of lease terms.”
Some operators also may be able to survive on credit, although this option is wearing thin for many. However, even as some producers are forced to restructure, bankruptcies may not reduce output because highly leveraged companies are able to shed their debt service, which lowers operating costs.
Overall, the lack of a large production response to falling prices likely is the result of rapid productivity gains and steadily falling costs to drill and produce, said the Fed analysts.
“Additionally, aggressive reallocation efforts by firms have provided further boosts to aggregate productivity. While some of the factors boosting production — such as reallocation and labor hoarding — are likely to be temporary, other factors represent permanent improvements in exploration and drilling methods. These productivity improvements have led to considerable declines in cash costs for operating wells, and in breakeven thresholds for new wells.”
Costs could fall even more, but “current breakeven estimates are generally higher than spot prices, suggesting that production growth may be muted for some time.”
Meanwhile, all-in costs for U.S. drilling continue to plummet, as producers have been noting in their quarterly reports. And even OPEC recently estimated that many projects in North Dakota’s Bakken Shale are profitable at $24-41/bbl.
© 2024 Natural Gas Intelligence. All rights reserved.
ISSN © 2577-9877 | ISSN © 1532-1266 | ISSN © 2158-8023 |