NatGas Cash Mixed; Futures Decline as Traders Shrug Off Bullish Storage Data
Physical natural gas trading was a mixed bag for the week ending May 13 as most of the country’s pricing points enjoyed gains from a couple of pennies to a little more than a nickel, with the exception of points in the Midwest and Northeast, where declines ruled. The divided nation resulted in NGI‘s National Spot Gas Average for the week standing pat at $1.87.
It was the week of the $1.90, as NGI’s South Texas (+5 cents), East Texas (+4), Midcontinent (+3) and North Louisiana/Arkansas (+5) regions arrived at that number as an average for the week. South Louisiana added a nickel to average $1.91.
In the West, Rocky Mountain point collectively added 4 cents to $1.79, while California points also tacked on 4 cents to average $2.00.
In the loss column, the Midwest Regional Average dropped a penny to $1.99 and the Northeast came off 12 cents to $1.70.
Individual location standouts included Enable South in the North Louisiana/Arkansas region, which added 17 cents to average $1.89. and the ever volatile Algonquin Citygate and Tennessee Zone 6 200 Line in the Northeast, which dropped by 41 cents and 49 cents, respectively, to $2.17 and $2.08.
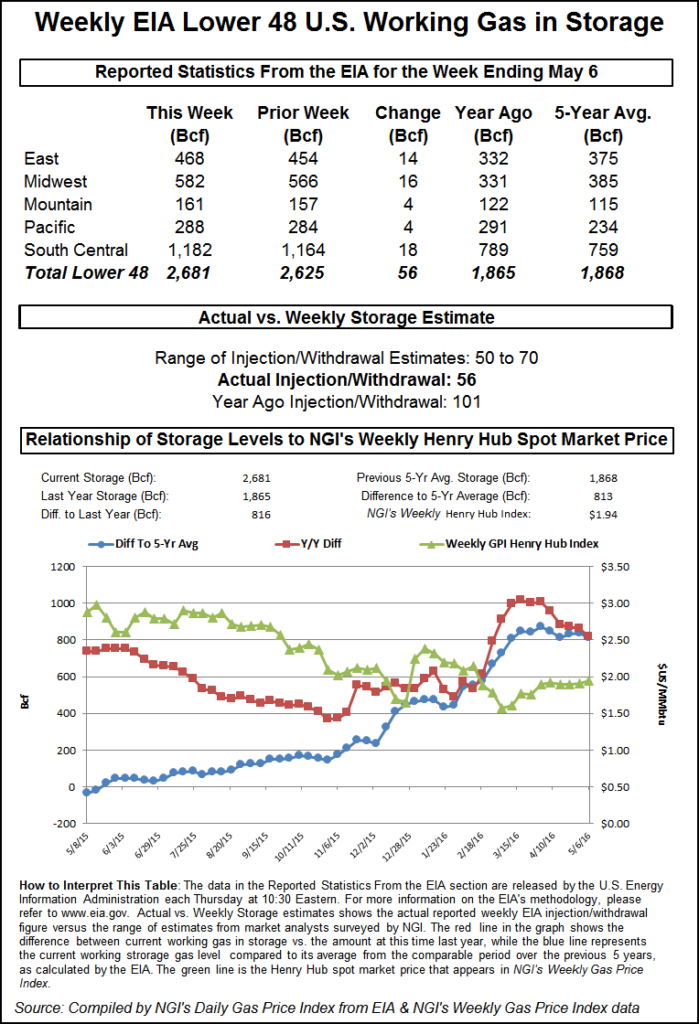
End-of-week selling on Friday produced a sea of red for natural gas prices for deliveries Saturday through Monday, while natural gas futures followed suit as the June contract slumped 5.9 cents from Thursday to finish the day’s regular session at $2.096, down five-tenths of a penny from the previous Friday’s close. Natural gas futures bulls and bears were equally unimpressed Thursday morning following news that a slightly-less-than-expected 56 Bcf was deposited in underground storage for the week ending May 6. In the minutes leading up to the Energy Information Administration’s (EIA) 10:30 a.m. EDT report on Thursday, June natural gas futures was trading around $2.168.
Immediately after the report’s release, traders weren’t quite sure what to make of the number as the front-month contract oscillated between $2.160 and $2.185. After the initial reaction, June futures crept lower to notch the day’s $2.125 low around noon before inching higher over the remainder of the session to close Thursday at $2.155, down 1.8 cents from Wednesday’s regular session close.
The actual 56 Bcf build was bullish when compared to historical figures as well as industry expectations. It was well below both last year’s 101 Bcf build and the five-year average injection of 79 Bcf. Heading into the report, a Reuters survey of industry experts produced a 50-65 Bcf injection estimate with a consensus expectation of a 58 Bcf build, while a Bloomberg survey extended the upside range with injection predictions between 50 and 70 Bcf. Citi Futures Perspective was expecting a build of 60 Bcf, and ICAP Energy estimated an increase of 55 Bcf. IAF Advisors/ION Energy’s Kyle Cooper was expecting a 57 Bcf build.
“The build of 56 Bcf was somewhat below the 58 Bcf consensus expectation and also supportive compared with the 79 Bcf five-year average increase,” said Citi Futures Perspective Analyst Tim Evans. “With the current temperature forecast supporting at least a few more weeks of below-average injections, we also see a constructive context here, with the declining year-on-five-year average storage surplus tending to support prices over the intermediate term.”
As of May 6, working gas in storage stood at 2,681 Bcf, according to EIA estimates. Stocks are now 816 Bcf higher than last year at this time and 813 Bcf above the five-year average of 1,868 Bcf. For the week, the South Central, Midwest and East regions injected 18 Bcf, 16 Bcf and 14 Bcf, respectively, while the Mountain and Pacific regions each chipped in 4 Bcf.
On Friday June natural gas futures traded within an 8.9-cent range between $2.075 and $2.164, but the fact that the contract was taking a loss on the day was never in question. Even with Thursday’s bullish storage report, futures remain largely range-bound. While acknowledging the slide in futures to the bottom of the recent range, Citi Futures Perspective Analyst Tim Evans is not counting the price bulls out yet.
“Natural gas is…seeing some selling to end the week, with prices still bottled up within their recent trading range,” he said Friday. “We continue to view the near-term fundamentals as constructive, with enough weather-related demand to limit storage injections over the next few weeks, trimming the year-on-five-year average storage surplus. [Friday’s] temperature forecast was mixed, in our view, adding a bit of demand for the week ahead but taking it away from the week ending May 27.”
Taking a look at the long game, some analysts see a lasting price recovery before the year is finished.
The U.S. gas markets “could see a sharp late-year upward move on tightening supply-demand conditions and more normal storage,” said Jefferies LLC analysts. “Supply is cracking (finally) amid severe underinvestment and worsening Northeast infrastructure bottlenecks…We remain gas bulls, estimating prices of $3.50/4.00 in 2017/long term. Weather-induced spikes above our forecast appear likely in many years.”
It’s back to the “days of ‘spikes and roses,'” the Jefferies analysts said. “We think the U.S. natural gas ‘set-up’ could be exceedingly bullish in 4Q2016-plus, with potential winter spikes well above our $3.50/MMBtu 2017 view. Why? The storage surplus is likely to be shed materially during refill season (our supply-demand factor model now shows Nov. 1 storage at 4.1 Tcf), production is falling, and capital formation and regulatory conditions for infrastructure are challenged.”
Producers can’t just turn on the gas taps if prices rise, Jefferies analysts said. “There is no argument here that vast quantities of low-cost gas resource exist in the U.S. onshore, but activation times measure at least six-to-nine months from the ‘time zero’ capital investment decision.” Jefferies’s updated 21-basin gas supply model shows 2016 production down 6.4% from 2015. Of note, preliminary March data showed a 1 Bcf/d month/month decline.
However, don’t underestimate the Marcellus Shale, said Morningstar Inc. Analyst Mark Hanson. If gas prices were to increase to $3.50/Mcf, the play would be “insanely attractive…It would only take 15 or 20 more rigs to ramp up production in a meaningful way.”
Judging by the Baker Hughes Inc. (BHI) rig report of a week ago, it looked as if the falling U.S. rig count was coming in for a landing; the most recent count suggests that it will be a bumpy one. In its survey for the week ending May 13, BHI said nine rigs left U.S. play (six from land, one from the inland waters and two from the offshore). That compares with the preceding week when only five U.S. units departed. However, a closer look at the data for the week ending May 13 shows that while 10 oil rigs packed it in during the week, one natural gas rig was actually added.
© 2024 Natural Gas Intelligence. All rights reserved.
ISSN © 2577-9877 | ISSN © 1532-1258 |