NGI Data | NGI All News Access
April NatGas Bidweek Quotes Up From March’s Sharp Losses
Natural gas bidweek players were able to breathe something of a sigh of relief that the devastating experience of March Bidweek was not repeated for the month of April. March saw most points nationally losing about a half-dollar, or more and NGI March National Bidweek Average came in at a lean $1.60. NGI‘s April National Bidweek Average rose 8 cents to $1.68 amid trading and deal-making characterized as more or less routine.
However, natural gas price bulls might want to stay in their corral for a bit. While the $1.68 national average marks a small rebound from March 2016, it is still well below historical comparisons — namely 67 cents less than NGI‘s April 2015 National Bidweek Average of $2.35, and $2.75 less than NGI‘s April 2014 National Bidweek Average of $4.43.
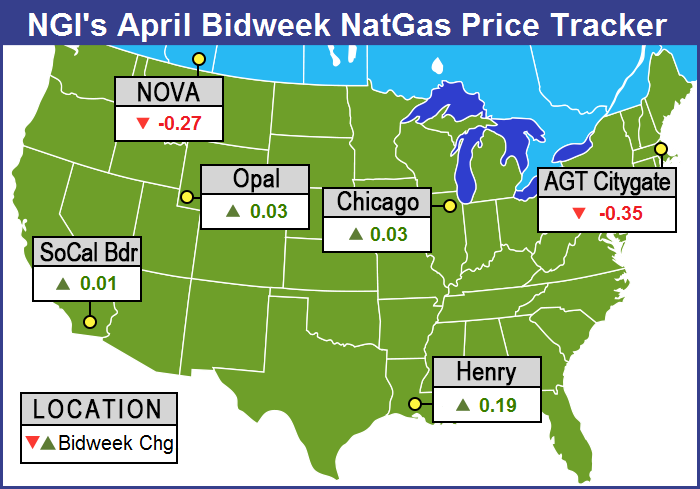
Natural gas storage — especially the lack of capacity — may be an issue throughout the injection season, but for now some buyers are electing to play the daily spot market. Regionally the Northeast had to put up with the lowest bidweek average at $1.46, up 2 cents. The Midwest made the top of the leader board with an average bidweek of $1.92, up a dime from the March average.
Rockies April bidweek gas added 3 cents to average $1.52 and the Midcontinent was seen a dime higher at $1.66. California April bidweek was quoted a penny higher than the previous month at $1.71.
Down around the Gulf Coast, prices were tightly packed. East Texas and South Texas each added 18 cents to average $1.82 and $1.84, respectively. South Louisiana added 19 cents to come in at $1.85.
Over in the futures arena, the April futures contract expired on Tuesday March 29 at $1.903, up 19.2 cents from the March contract settlement. Of even more interest is the fact that prompt-month futures are flirting with the $2 handle for the first time in seven weeks.
The storage injection season for some is not in full swing. “It’s a little bit of a transition month. Weather is still a little cool in some areas, but in general most people have pulled all their winter storage out of the ground,” said a Houston-based industry pipeline veteran. “Some of the retail guys will have to inject.
“A lot of new deals start. You have your November-March winter deals, and now you have summer deals starting. If people have too much gas in storage, it will be factored into their April-October contracts,” he added. “Some storage fields don’t get all their gas out until mid-April, and it just depends on what pipe you are talking about and what area.” He noted that April bidweek was “looking pretty straightforward.”
A Florida utility trader said this year’s robust storage situation altered his strategy a bit this bidweek. “We didn’t baseload much for April,” he told NGI. “We have plenty of storage and we are going to play the daily market.”
On Thursday the Energy Information Administration (EIA) reported a withdrawal of 25 Bcf from storage for the week ending March 25, and in spite of the fact that most traders were expecting a pull about 3 Bcf lower, futures prices eased.
Estimates for the Thursday morning EIA storage report were coming in widely dispersed. Last year 10 Bcf was withdrawn, and the five-year pace is for a 22 Bcf decline. Ritterbusch and Associates was calculating a 16 Bcf pull, and a Reuters survey of 24 traders and analysts revealed an average 22 Bcf withdrawal with a range of 16 to 33 Bcf. ICAP Energy figured on a 28 Bcf decline.
Last week’s 15 Bcf build caught a number of analysts off guard as it was about 7 Bcf less than what was expected. May futures were trading at $2.015 when the EIA data rattled across trading screens and by 10:45 a.m. EDT May was trading at $1.985, down 1.1 cents from Wednesday’s settlement.
“I had heard a 22 Bcf withdrawal, but others were telling me 27 to 28, so the 25 Bcf draw doesn’t come as much of a surprise,” said a New York floor trader. “We are solidly in the $2 range, and I look for trading between $1.90 to $2.10.”
Could supply be getting a little tighter? “The 25 Bcf draw for last week was somewhat more than expected and marginally supportive compared with the 22-Bcf five-year average for the date,” said Tim Evans of Citi Futures Perspective. “It also suggests a somewhat tighter supply-demand balance baseline that may carry over into future periods.”
Inventories now stand at 2,468 Bcf and are a stout 1,002 Bcf greater than last year and 843 Bcf more than the five-year average. In the East Region 14 Bcf was withdrawn and the Midwest Region saw inventories fall by 16 Bcf. Stocks in the Mountain Region fell 1 Bcf, and the Pacific Region was higher by 2 Bcf. The South Central Region added 4 Bcf.
Record high inventories in the Lone Star State may make finding storage capacity in Texas arduous at best. According to industry consultant Genscape “storage monitors are indicating Texas’ combined inventory currently stands at approximately 695 Bcf, the highest March inventory in history. Texas inventory for March 2016 will come in close to 46 Bcf higher than in March 2012. At each of the seven facilities monitored, activity has either stagnated or transitioned to steady injections over the past few weeks.
“If the region sees no additional withdrawals, Texas will have ended the winter with stocks only 73.6 Bcf lower than the record-setting seasonal peak in November,” Genscape said. “Entering the summer with such low capacity for injection could make for a very interesting season. North Lansing sits a mere 25 Bcf below its reported working gas capacity. Bammel is similarly positioned with just below 14 Bcf of its capacity available. The summer months will likely prove to be relatively lethargic as overall injections should amount to less than half of those seen last year.”
One trader said at the close that the disappointing performance by futures was due to numerous anxious sellers willing to take the best price they could get. “It was really disappointing price action,” a New York floor trader told NGI.
Some analysts are holding fast to lower prices. “[Thursday’s] price action fortified our bearish outlook in this market as the 25 Bcf storage withdrawal was at the high side of expected street ideas and well above our expected 16 Bcf decline,” said Jim Ritterbusch of Ritterbusch and Associates.
“The supply surplus against five-year averages was negligibly changed at 843 Bcf. This overhang continues to restrict occasional price advances as was clearly evidenced today. But at the same time, the near-record supply is also well discounted and as a consequence, the huge stockpile is becoming a well-worn reason for anticipating lower values.
“We have adjusted our price parameter for the May contract to the $1.73 level but may be forced to raise it again if production shows further evidence of decline. At the end of the day, this market could easily morph into a low volume narrow range trade across most of next month as the weather factor loses further influence. Next support develops at the Monday lows of $1.84, but a test of this level could easily await another EIA storage report. But for now, we suggest maintaining any short positions established within the $1.95-2.00 zone as we tweak our suggested stop point downward to the $2.03 level on a close only basis.”
Going into the week’s trading, technical analysts noted that futures failed the previous week to breach key technical resistance, thus setting the stage for a move lower to test market support. United ICAP in a weekly report Monday said, “The bear case for another set of new lows in natgas required a reversal lower by the $1.963 level. Natgas reversed lower from a $1.957 high [March 18]. The bull case pegs the $1.680 to $1.660 key support. The bear case suggests $1.590 to $1.510 key support.
“All of these levels are well within striking distance. And the background question is whether we get a preseason rally from one of these levels into a summer peak.”
The technical picture for natural gas changed with the strong performance by the expired April contract advancing nearly 10 cents Monday and Tuesday. In what may be a prescient comment Tuesday, technical analysts saw the market poised to break into new high territory. “Moment of truth for the bulls,” said Brian LaRose, technical analyst with United ICAP.
“If this rally is legit, the May contract should be able to blow through $1.980 (flat price resistance) and $2.023-2.043-2.056 (May contract resistance),” he said. “Succeed and there is immediate airspace up to $2.112-2.138 (a=c from 1.611) next. Fail to punch through resistance and a larger degree ABC type pattern will have an opportunity to develop from the $1.957 high.”
© 2024 Natural Gas Intelligence. All rights reserved.
ISSN © 1532-1258 | ISSN © 2577-9877 |

