NGI Archives | NGI All News Access | NGI The Weekly Gas Market Report
Shale Natural Gas to Account for 20% Share of Total Global Gas Output by 2035, Says BP
Shale natural gas, ramrodded by U.S. producers, should amount to about 75% of domestic gas output and nearly 20% of total global gas production by 2035, compared to 10% of global share in 2014, a stronger forecast than BP plc’s economics team previously projected. And it could get even better, chief economist Spencer Dale said Wednesday.
The 2016 edition of the BP Energy Outlook to 2035 is the supermajor’s annual compendium that forecasts worldwide fossil and renewable fuel supply/demand trends. Many of its peers also issue annual global fuel forecasts, including ExxonMobil Corp., which unveiled its projections last month (see Daily GPI, Jan. 25). Dale and Group CEO Bob Dudley unveiled BP’s to a webcast audience of 5,000-plus, about 40% larger than a year ago.
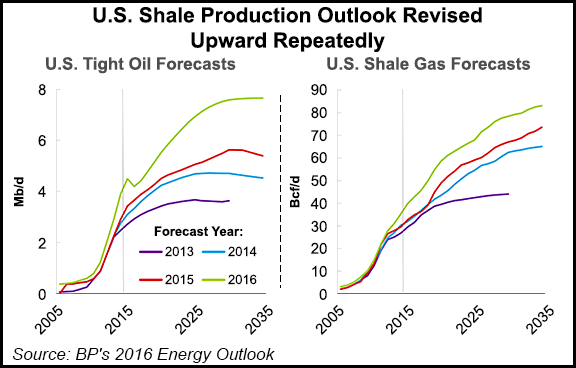
One of the biggest positives in this year’s report is the U.S. shale production outlook, particularly for gas, which was raised again as technology and productivity gains have unlocked new resources.
“We have been repeatedly surprised by the strength of U.S. tight oil and shale gas,” Dale told the audience. “Technological innovation and productivity gains have unlocked vast resources of tight oil and shale gas, causing us to revise the outlook for U.S. production successively higher.”
In BP’s 2013 outlook, U.S. tight oil was projected to reach 3.6 million b/d by 2030, but it surpassed that level in the 2014 outlook (see Shale Daily, June 16, 2014).
BP now is forecasting U.S. shale gas to grow by around 4%/year to 2035.
“This causes U.S. shale gas to account for around three-quarters of total U.S. gas production in 2035 and almost 20% of global output,” Dale said. “The past surprises in the strength of the shale revolution underline the considerable uncertainty concerning its future growth,” which could be even stronger than the current projections.
Shale gas production is seen as expanding rapidly, boosted by increasing output outside North America.
Global shale gas is expected to grow by 5.6%/year to 2035, “well in excess of the growth of total gas production,” Dale said. “As a result, the share of shale gas in global gas production more than doubles, from 11% in 2014 to 24% by 2035.”
The gas supply growth in unconventionals is dominated by North American output, as it has been for the past decade, accounting for around two-thirds of the increase in global shale gas supplies.
“But over the outlook period, we expect shale gas to expand outside North America, most notably in Asia Pacific and particularly in China, where shale gas production reaches 13 Bcf/d by 2035,” said the chief economist. “In the last 10 years of the outlook, around half of the increase in shale gas supplies comes from outside North America, with the Asia Pacific region accounting for over 10% of global shale gas production by 2035.”
Following a “brief retrenchment” on low prices and falling investment, U.S. tight oil production should begin to plateau in the 2030s at nearly 8 million b/d, accounting for almost 40% of total domestic oil production as North American growth gradually moderates.
Global tight oil production increases by 5.7 million b/d over the outlook to around 10 million b/d in the forecast period to 2035.
However, even with this “sizeable growth, tight oil accounts for less than 10% of all liquids production in 2035,” Dale said.
Growth in North American tight oil, which has been the dominant source of growth over the past 10 years, is seen slowing gradually over the next 20 years, “constrained by the size of the resource base.”
North American production tight oil production is expected to grow by 2.5 million b/d between 2015 and 2025, and by only 1 million b/d between 2025 and 2035, compared with 4.5 million b/d during the past 10 years.
“This slowing is partially offset by increased production in the rest of the world,” Dale said. “During the final 10 years of the outlook, almost half, 0.9 million b/d, of the increase in tight oil production is from outside North America.”
However, Dale said there are “key uncertainties” to the forecast, as shale oil and gas may have “even greater potential,” which would have significant implications for global energy supply.
“The ‘stronger shale’ case assumes global shale resources are significantly bigger than in the base case,” which in the United States is by 50% for oil and 30% for gas, and elsewhere by 100% for oil and 50% for gas. In the stronger case, productivity gains from efficiencies in drilling are 20% higher by 2035.
“As a result, global supplies of tight oil and shale gas are much greater than in the base case,” Dale said. “The higher weight of shale gas within global gas supplies, and the greater ability of gas to substitute for other fuels, means the impact is more marked for shale gas than for tight oil.”
In the stronger case, shale gas production is about 76 Bcf/d higher by 2035, accounting for more than one-third of global gas supplies. Global tight oil output increases to 20 million b/d by 2035, twice its level in the base case, with its share of total liquids output reaching 18%.
Under the stronger scenario, higher shale output would crowd out conventional production and other fuels.
“In the oil market, tight oil is around 10 million b/d higher by 2035 than in the base case, whereas total oil production is only 6 million b/d higher,” Dale said.
The Organization of the Petroleum Exporting Countries (OPEC) is assumed under the stronger case to respond to the growth in tight oil by increasing production to maintain its market share.
“As a result, the decline in nonshale supplies relative to the base case, minus 4 million b/d, is concentrated within non-OPEC,” i.e. North America. “In the gas market, shale and tight gas, included in the positive supply shock, are up by a combined 100 Bcf/d in 2035 versus the base case.”
Conventional gas and coalbed methane supplies then would fall in the strong shale gas case by 45 Bcf/d in aggregate, “leaving total gas production 56 Bcf/d higher by 2035.”
Fuel substitution also would be “most pronounced in the power sector where gas competes with all other fuels” under the strong case scenario. The main casualty is coal, while the share of renewables also would decline.
© 2024 Natural Gas Intelligence. All rights reserved.
ISSN © 2577-9877 | ISSN © 1532-1266 | ISSN © 2158-8023 |