NGI The Weekly Gas Market Report | Markets | NGI All News Access
Long-Term Recovery Due For NatGas Prices After 2015 Drubbing
Natural gas prices sagged ever further in 2015, pressured downward by production growth and generally mild weather, according to an Energy Information Administration (EIA) review, but there is light at the end of the tunnel.
In an analysis based on NGI price data, the EIA on Tuesday said natural gas spot prices at the Henry Hub averaged $2.61/MMBtu in 2015, the lowest annual average since 1999 — and 41% lower than the 2014 average — and daily prices last year fell below $2.00/MMBtu for the first time since 2012.
The price situation is even worse than indicated by EIA’s analysis, which is focused on a nominal basis, according to NGI’s Patrick Rau, director of strategy and research.
“After converting all prices to 2015 dollars (the real basis), prices are actually as low as they have been since 1991,” Rau said.

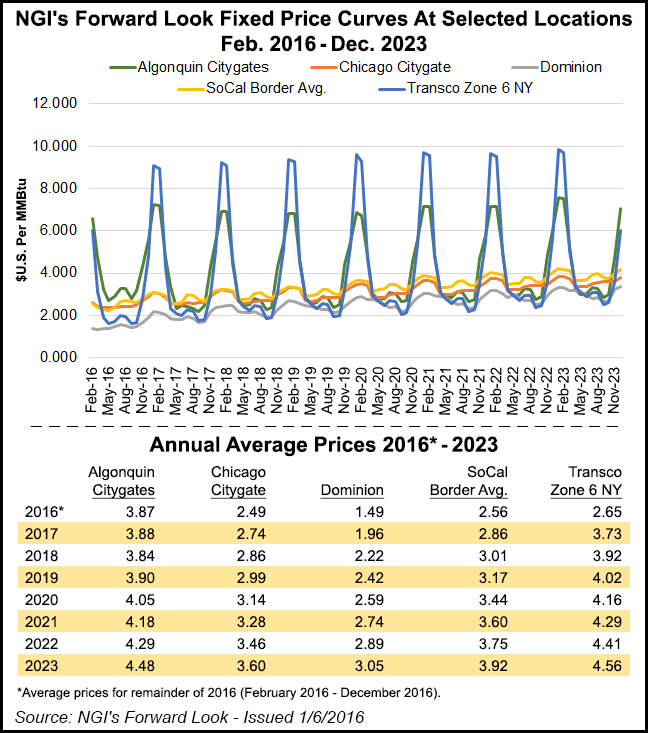
However, going forward, the long-term direction is up, according to NGI’s Forward Look (see accompanying chart). The trend will be more pronounced at certain locations.
Annual average prices at Algonquin Citygates, for example, are forecast at $3.87/MMBtu this year, $4.05/MMBtu in 2020 and $4.48/MMBtu by 2023. Larger increases are expected at Chicago Citygate ($2.49/MMBtu this year; $3.60/MMBtu in 2023), Dominion ($1.49/MMBtu this year; $3.05/MMBtu in 2023); SoCal Border Avg. ($2.56/MMBtu this year; $3.92/MMBtu in 2023); and Transco Zone 6 NY ($2.65/MMBtu this year; $4.56/MMBtu in 2023).
Looking back at 2015, “Henry Hub prices began the year relatively low and fell throughout 2015, as production and storage inventories hit record levels and fourth quarter temperatures were much warmer than normal,” EIA said Tuesday. And prices at key regional trading hubs ended 2015 lower than they started the year.
“At northeastern locations, where natural gas transmission infrastructure is often constrained, prices spiked in the early months of 2015, which were colder than normal compared to much of the United States,” EIA said.
Readings of the futures market would have producers facing a bleak outlook, according to data from NGI’s Forward Look (see Forward Look, Dec. 31, 2015).
“Prices at major trading points are expected to remain at lower levels for some time, but a slow recovery is expected to occur,” said NGI markets analyst Nate Harrison. “At Algonquin Citygates, where gas tends to trade at one of the highest premiums in the country, prices are expected to average just $3.87 for the rest of 2016.”
However, the futures market doesn’t tell the whole story. “In light of recently slashed capital expenditure budgets and rig counts, an ultimate recovery — when demand takes over — will likely be abrupt and vigorous,” Harrison said, pointing out that historically the oil and gas market has been given to sharp turns based on mismatches of supply and demand.
“At production points such as Dominion South, the market is implying a price of just $1.49 for the remainder of this year,” Harrison said. “However, Dominion South’s significantly discounted price is largely due to its location in the heart of the Marcellus Shale gas glut, and once additional takeaway capacity comes online, things could change in a hurry.”
The dark clouds of 2015 had a sliver of a silver lining. Low prices and continuing strong production led to increased use of gas for electric power generation, which EIA has projected to be about 26.5 Bcf/d in 2015, compared with 24.9 Bcf/d level in 2012 (see Daily GPI, Dec. 31, 2015a).
Natural gas surpassed coal as the leading source of electricity generation on a monthly basis for the first time last April, and again in each of the four months from July through October (see Daily GPI, Dec. 28, 2015).
But in the residential and commercial sectors, which use gas primarily for heating, consumption last year declined compared with 2014 by 6.7% and 4.4%, respectively, because of warmer weather and low levels of new residential housing construction.
Growth in production last year also allowed for strong builds in working gas inventory. Inventories surpassed 4,000 Bcf for the first time, reaching 4,009 Bcf in the week ending Nov. 20 (see Daily GPI, Nov. 25, 2015). For the week ending Dec. 25, EIA reported gas inventories at 3,756 Bcf (see Daily GPI, Dec. 31, 2015b).
© 2024 Natural Gas Intelligence. All rights reserved.
ISSN © 1532-1231 | ISSN © 2577-9877 | ISSN © 1532-1266 |