NGI Data | NGI All News Access
Weekly Natgas Weakens, But Equity Markets Spiral Lower
There were a lot of long faces in both the energy and financial markets for the week ended Aug. 21. Natural gas physical and futures both sustained a double-digit drubbing and the NGI Weekly Spot Gas Average fell 14 cents to $2.54. That, however, paled in comparison to the 531-point swan dive the Dow Jones Industrial Average took on Friday.
All regions were in the loss column, but of individual market points the week’s greatest gainer was Algonquin Citygate with a gain of 40 cents to $2.71 followed closely by Tennessee Zone 6 200 L with a rise of 36 cents to $2.66. Transco Leidy proved to be at the bottom of the standings with a loss of 46 cents to 78 cents. Regionally the Northeast and Midwest lost the least giving up 11 cents to $1.95 and $2.84, respectively and the Rocky Mountains took the biggest hit dropping 20 cents to $2.53.
The Midcontinent skidded 18 cents at $2.62 and East Texas was off 16 cents at $2.67.
South Texas, South Louisiana, and California all fell 15 cents to $2.66, $2.69, and $2.88,respectively.
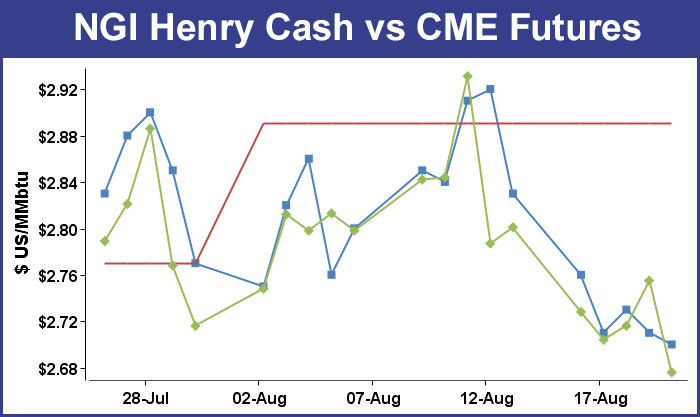
September natural gas marched to a similar tune as the physical market dropping double digits of its own. For the week September shed 12.5 cents $2.676, but this time around the price action following the Energy Information Administration (EIA) was not a factor. Traders actually reacted somewhat bullishly following the news Thursday that 53 Bcf was injected into underground storage for the week ending Aug. 14, a number that was somewhat smaller than industry expectations.
September natural gas futures reached a high of $2.781 shortly after the report was released and as of 11 a.m. EDT, the prompt-month contract was trading at $2.765, up 4.9 cents from Wednesday’s close.
Heading into the report, ICAP Energy was looking for a fill of 60 Bcf, and IAF Advisors was looking for a 58 Bcf injection. A Reuters survey of 20 industry cognoscenti revealed an average 58 Bcf build with a range of 44 to 68 Bcf. The actual 53 Bcf build compares to last year’s stout 86 Bcf build for the week. The five-year average injection stood at 48 Bcf.
Citi Futures Perspective analyst Tim Evans called the number “bullish,” noting that the injection was somewhat less than expected.
“The 53 Bcf build for last week was a larger-than-expected decline from the 65 Bcf refill a week ago, and it matched the five-year average for the date,” Evans said. “This should be reassuring to the market that the surprise bearish build of the prior week has not translated into an ongoing weaker supply-demand balance.”
Working gas in storage now stands at 3,030 Bcf as of Aug. 14, according to EIA estimates. Stocks are now 488 Bcf higher than last year at this time and 80 Bcf above the five-year average of 2,950 Bcf. For the week, the East Region added 50 Bcf and the West Region chipped in 4 Bcf, while the Producing Region switched to withdrawals for the second time in three weeks with a 1 Bcf decline.
Traders Friday saw no reason to commit to extended three-day deals when weather forecasts for major metropolitan areas looked to be near-normal if not below normal temperature patterns.
The NGI National Spot Gas Average retreated 5 cents to $2.48. Firm Monday power prices did support gas prices in isolated markets, but few points made it into the profit side of the trading ledger.
Futures were also soft, giving up an almost equal amount as the physical market, but on a relative scale natural gas contracts were something of a sanctuary of safety as equity markets plunged. September natural gas shed 7.9 cents to $2.676 and October fell 8.8 cents to $2.697. Newly minted as the spot oil contract, October dropped 87 cents to $40.45/bbl. The Dow Jones Industrial Average plunged 531 points to 16,460 or 1,018 points on the week making it the worst week in nearly four years.
“We’re starting to see a little concern here,” said a New York floor trader. “It’s been a long time since we’ve seen $3, and we are now approaching the bottom of the long-term trading range at $2.50.”
Analysts reiterated that the natural gas market was relatively isolated from the travails of equity markets and global economic concerns. “[T]he gas market is largely a domestic market immune to negative international developments such as the weakening in the Chinese economic growth path that is currently spooking much of the global financial and commodity spaces,” said Jim Ritterbusch of Ritterbusch and Associates in a note to clients.
“And, with the weather factor diminishing as a price driver with the approach of the shoulder period, the possibility of a major price swing of much more than 20-25 cents in either direction becomes even more remote.”
Even with a hurricane looming in the Atlantic and poised to hit either Florida or the Gulf Coast, prices aren’t likely to move much.
“[B]oosting values much above the estimated middle of our expected short-term trading parameter, roughly $2.82 will prove difficult, even allowing for some extended warm weather forecasts. A three-day Labor Day holiday will be approaching when industrial demand will be downsized further, and piecing together a pricing scenario capable of boosting nearby futures more than 25 cents from yesterday’s settlement will remain extremely difficult.”
Natural gas equities were also pummeled. The First Trust ISE-Revere Natural Gas Index Fund (FCG) tumbled 17 cents, or 2.64%, to $6.26.
The National Hurricane Center in its 5 p.m. EDT report said Hurricane Danny had sustained winds of 115 mph and was about 860 miles east of the Leeward Islands. It was moving to the west-northwest at 10 mph (see related story).
“Some additional strengthening is possible [Friday], but Danny should begin to weaken on Saturday. Danny is a tiny hurricane. Danny is moving into an area of unfavorable upper-level winds, and weakening is forecast during the next 48 hours. Hurricane-force winds extend outward up to 10 miles (20 km) from the center and tropical storm force winds extend outward up to 60 miles (95 km),” NHC said.
Physical markets weakened as weekend weather forecasts could muster no more than about normal temperatures. Wunderground.com said Friday’s high of 85 in New York City would reach 87 Saturday and fall back to85 by Monday. The seasonal high in New York City is 82. Chicago’s Friday high of 83 was seen holding Saturday before falling to 77 Monday. The normal high in Chicago is also 82.
Gas at the Algonquin Citygate fell 41 cents to $2.35, and deliveries to Iroquois Waddington shed 9 cents to $3.01. Gas on Tennessee Zone 6 200 L changed hands 31 cents lower at $2.38.
Major Hubs were a nickel to a dime lower. At the Chicago Citygate, weekend and Monday packages retreated 4 cents to $2.77, and gas on El Paso Permian was 8 cents lower at $2.51. Henry Hubparcels were quoted at $2.70, down a penny, and deliveries to PG&E Citygate fell a nickel to $3.11.
WSI Corp.in its Friday morning outlook said, “The latest six-10 day period forecast has trended warmer than yesterday’s forecast over a good portion of the West into the northern Plains. Otherwise, much of the central and eastern U.S. is cooler. PWCDD are down 2.9 to 43.9 for the CONUS.
“Confidence in the forecast has improved and is average at best today. Medium-range models are in better agreement with recurving typhoons and the resulting pattern, but there are still technical issues and residual uncertainty. The risk is to the warmer side across the Southwest, Rockies, Plains and the Midwest. The South and the northwestern U.S. have a risk to the cooler side.”
Tom Saal, vice president at FC Stone Latin America LLC, in his work with Market Profile said Friday in a note to clients, “One of the best features of Market Profile is the horizontal dimension of displaying participating trader behavior.” In discussing a profile of the September contract, he noted that the profile “shows lots of trades taking place in the $2.800 area (aka Mode) which can act like a magnet. Note the indentation (lack of trades) at the $2.750 area and the market’s attempt to ‘fill in’ that area.”
© 2024 Natural Gas Intelligence. All rights reserved.
ISSN © 2577-9877 | ISSN © 1532-1258 |