East, Mid-Atlantic NatGas Points Post Record Low Daily Quotes; Futures Gain
Thursday was a great day to be a buyer if you needed natural gas for the extended holiday weekend, but buyers on average were few and far between, and spot physical prices fell, with numerous record lows recorded in the East.
Awash in ample gas supply, mild temperatures and low holiday demand, several eastern physical natural gas points posted record low daily prices, and a few Gulf Coast points managed to make it into the black, but overall, NGI’s National Spot Gas Average fell 9 cents to $2.38.
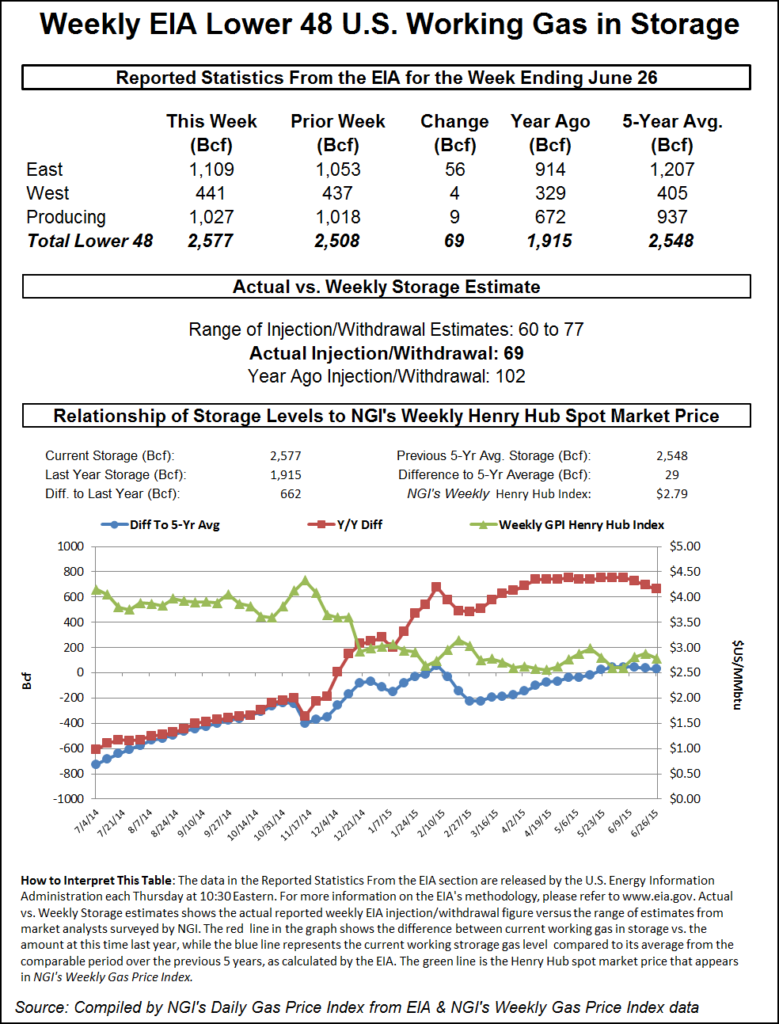
Futures managed to ignore the floundering physical market and recovered a portion of Wednesday’s losses after a narrowly supportive Energy Information Administration (EIA) report put a firm undertone to the market. The EIA reported a storage build of 69 Bcf, just 1 Bcf less than what most traders were expecting. At the close August was up 3.9 cents to $2.822 and September gained 3.8 cents to $2.837. August crude oil eased 3 cents to $56.93/bbl.
Traders are generally reluctant to commit to three-day deals over weekends, let alone a four-day commitment out to July 6. The lack of buyers and little in the way of forecast weather-driven demand sent prices at New England and Mid-Atlantic points to new historic lows.
Gas for the four-day period at the Algonquin Citygate plunged 41 cents to average 82 cents, well below the record low of $1.19 — recorded June 5, 2015 — tallied byNGI since the inception of trading in 1999. Gas on Tennessee Zone 6 200 L dropped 26 cents to average $1.01, well below its previous low of $1.25, which was also recorded on June 5. Gas at Iroquois Waddington didn’t set any new lows, but it did retreat 67 cents to $1.82.
Gas bound for New York City on Transco Zone 6 fell 35 cents to 89 cents, sharply below its previous record low of $1.24, which was set on Wednesday, and gas on Tetco M-3 Delivery fell 36 cents to 78 cents, far less than the previous NGI record low of $1.13, which was recorded on Dec. 23, 2014.
One eastern marketer likened the outbreak of low prices to an epidemic. “I remember when the worst prices would be on a May long weekend and a July long weekend. This is not a surprise. There is no weather except in the West. This is crazy, but I think we will see this next summer, too. There will be more gas next summer and it will hit Chicago. The contagion continues.”
Some Marcellus points were also not immune. Gas on Dominion South fell 34 cents to 72 cents, well off the record of 91 cents (1/2/2015), and gas on Millennium fell 28 cents to 77 cents, 18 cents less than its record low (6/8/2015). On Transco-Leidy Line, weekend deliveries fell 38 cents to 63 cents, and gas on Tennessee Zone 4 Marcellus changed hands 37 cents lower at 60 cents. The all-time lows for Transco Leidy and Tennessee Zone 4 Marcellus are 36 cents, according to NGI data.
High forecast power loads were not enough to move California buyers. CAISO forecast Wednesday’s peak load of 38,527 MW would rise to 39,719 MW Thursday. Gas at Malin fell 9 cents to $2.67, and gas at the PG&E Citygate shed 10 cents also to $3.19. SoCal Citygate gas was quoted at $3.17, down 8 cents and at the SoCal Border weekend gas came in at $2.93, down 13 cents.
Overnight weather models turned more uncertain, with mixed patterns east and west. “Hopes of a better model consensus and clearer forecast picture going into the three-day holiday weekend have been dashed as the models show a muddier story with increased uncertainties,” said forecaster Commodity Weather Group in its Thursday morning report. “On the whole, today’s forecast sees cooler changes East and South in the one- to five-day, warmer to hotter changes Midwest to East (cooler West) for the six-10 day, and the 11-15 day is slightly warmer to hotter East Coast, while cooler again West.
“The situation appears too active for a major heat wave pattern look (still rainy risks), but at the same time, upper-level heights are too warm for significant cooling. What we get is this muddled look with lots of near-normal on the maps,” said Matt Rogers, president of the firm.
Analysts saw elevated power generation requirements as prompting a below-normal storage build. The 10:30 a.m. EDT report by the EIA was expected to see injections generally in the vicinity of 70 Bcf, less than last year’s 102 Bcf injection and the five-year pace of 75 Bcf.
“Power burn demand drove the entirety of the increased demand compared to the previous week, and averaged 32.3 Bcf/d during the week, which marks the highest that power burn demand has averaged during a given week since 2012,” said Bentek Energy. “Power demand peaked as high as 34.6 Bcf/d during the week, which is the strongest burn levels have peaked all year.”
Other estimates included Ritterbusch and Associates at 77 Bcf; a Reuters survey of 24 traders and analysts revealed a sample mean of 70 Bcf with a range of 60 Bcf to 77 Bcf. Bentek Energy calculated a 70 Bcf increase.
The 69 Bcf was not all that much of a surprise. “67 to 70 Bcf was the number people were looking at, and I can tell you the market did not move at all once it came out. We were trading $2.825 and it wasn’t until 10 minutes later that the market rose to $2.875. It was a very delayed reaction,” said a New York floor trader.
Analysts, however, viewed the report as basically neutral. “The 69 Bcf net injection for last week was quite close to the consensus expectation and moderately below the 74-Bcf five-year average for the date,” said Tim Evans of Citi Futures Perspective. “While constructive, we don’t see the market as driving significant support from the report, as the outlook for upcoming reports will still feature a swing back to above-average injections.”
Inventories now stand at 2,577 Bcf and are 662 Bcf greater than last year and 29 Bcf more than the 5-year average. In the East Region 56 Bcf was injected and the West Region saw inventories increase by 4 Bcf. Stocks in the Producing Region rose by 9 Bcf.
© 2024 Natural Gas Intelligence. All rights reserved.
ISSN © 1532-1231 | ISSN © 2577-9877 |