U.S. Oil Supplies Already Declining, But Not For Long, Raymond James Says
Domestic oil supply in all likelihood already has rolled over, but don’t expect the decline to last, said analysts with Raymond James & Associates Inc.
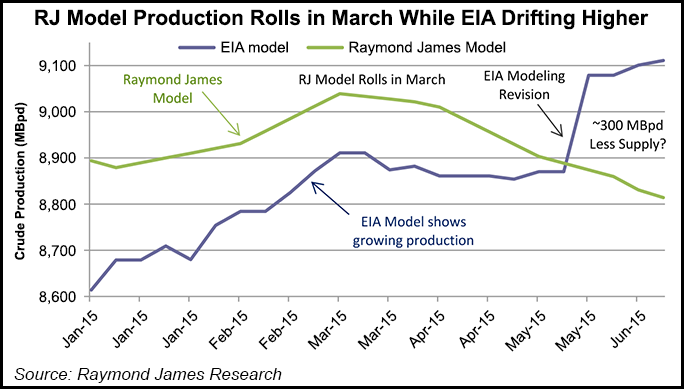
Weekly supply data issued by the Energy Information Administration (EIA) indicate that domestic crude output continued to expand through June, but analysts believe otherwise. It’s actually been falling for the past three months, J. Marshall Adkins and his team said in a report on Monday.
“The fact is, weekly changes in U.S. oil supply are the most uncertain variable in the U.S. supply-demand picture and the EIA can’t accurately measure ‘real-time’ U.S. oil supply numbers,” he wrote in this week’s Energy Stat. “That said, we think a reasonable (and more accurate) proxy can be formed by adjusting the weekly U.S. supply estimate with the EIA’s own weekly ‘missing barrels.’ After making this plug number adjustment, the weekly U.S. oil data appears to show that U.S. crude production peaked in March and has been falling since that time.”
Over the past few weeks, the firm’s analysts have focused on tracking “missing barrels” of oil around the world. They proposed that the imbalance, or plug, within the International Energy Agency (IEA) global oil model largely has been driven by a combination of underestimated oil demand and Chinese crude stockpiling. Many investors are aware of IEA’s global plug, which represents understated demand. EIA’s weekly oil data also uses a plug number to balance its measured weekly domestic oil supply, demand and inventories.
EIA does not retroactively revise weekly data, but it provides “more accurate numbers” in the monthly reports. “This means the most accurate U.S. oil data we have today is from the March monthly report.” That’s “a problem because the EIA’s weekly data shows U.S. oil supply continuing a steady climb to current all-time highs, while our production-by-play model shows U.S. oil supply has been falling at an increasing pace since March.”
By misinterpreting “the negative U.S. plug in the weekly oil inventory” a signal has been sent of an “incrementally looser (or bearish) U.S. oil market, while we believe U.S. oil production is already falling. ” The conclusion reached by analysts would mesh with other “more macro-focused models,” such as EIA’s Drilling Productivity Report, as well as the firm’s “re-engineered” production play model.
Based on Raymond James’ model, oil production began to decline in the March-April timeframe. Because of a “significant lag associated with collecting state level production data, production will likely not become a true ‘actual’ until four to six months past a given date,” Adkins said. “The largest difference between our model and the EIA’s DPR is the severity with which production rolls.” The steepest declines were in May, according to Raymond James’ data.
“After sequential monthly declines of 75,000-100,000 b/d in May-July, our model suggests slowing rates of decline through the rest of 2015 with sequential U.S. oil production turning positive again at the beginning of 2016. In contrast, the EIA DPR is forecasting a more gradual reduction, with the steepest sequential U.S. oil supply decline in July 2015.”
The difference in the forecasts could be how well decline rates are modeled. The relatively steep declines early in 2015 are because the average well “is still relatively new. In contrast, using the EIA’s approach, well declines should initially under-represent actual declines, leading to a more modest production decline.”
Raymond James has a U.S. oil supply model that is built on “specific basin-type curves,” which yield declines that “should first be rapid and then quickly slow the rate of decline steadily through 2015.” That model indicates output decline rates peaking now, followed by slower rates of decline in the last six months of the year.
Even on an absolute level, domestic oil output won’t fall for long, according to Adkins.
“We expect initial production rate efficiencies to ramp quickly as high-grading takes full effect. Additionally, we believe rig counts are bottoming and should grow in the back half of 2015. This means U.S. oil production should bottom out at the end of 2015 and begin growing again through 2016.”
It may take time for the decline rates to increase and reach 2014 levels again. However, even with lower new well counts and new production lower than in 2014, “a field should be capable of growing production faster than it might have in 2014 with a lower rig count. This lower overall decline rate is likely to be seen throughout 2016 and extending into 2017.”
© 2024 Natural Gas Intelligence. All rights reserved.
ISSN © 2577-9877 | ISSN © 2158-8023 |