Surpluses to Dampen North American NatGas Prices Through 2017, NEB Says
“Intensified” surpluses will keep the lid on North American natural gas prices through 2017, the National Energy Board (NEB) predicted in a three-year Canadian deliverability forecast.

Barring a surprise return of the “polar vortex” blizzards that made the second-to-last winter a stellar season of high heating demand, all NEB scenarios anticipate prices will stagnate at levels well below the 2014 annual average.
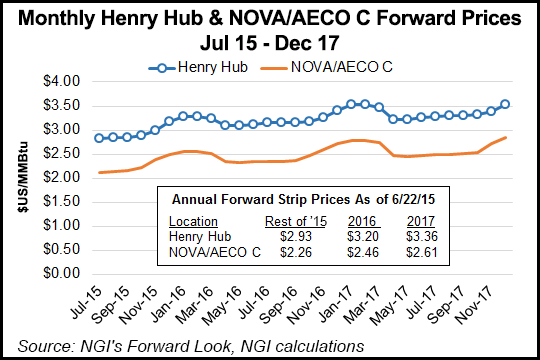
The board’s high-case outlook for the continental Henry Hub trading hub trading benchmark foresees annual averages dropping from US$4.35/MMBtu in 2014 to US$3.05 this year, US$3.30 in 2016, and US$3.90 in 2017.
The continental low case calls for US$2.70/MMBtu this year, US$3.00/MMBtu in 2016, and US$3.10/MMBtu in 2017. The NEB mid-range Henry Hub forecast is US$2.90/MMBtu this year, US$3.20/MMBtu in 2016, and US$3.90/MMBtu in 2017.
Even leaner times are projected to lie ahead for Canada’s benchmark — the Alberta reference price, a production-weighted average of actual industry receipts used to calculate provincial government royalties.
The NEB’s high-case outlook for the Alberta standard warns the Canadian gas industry to be braced for a drop from C$4.25 per gigajoule (GJ) — the equivalent of US$3.57/MMBtu — in 2014 to C$3.00/GJ (US$2.52/MMBtu) this year, C$3.25/GJ (US$2.73/MMBtu) in 2016, and C$3.50 (US$2.94/MMBtu) in 2017.
The Alberta low case anticipates C$2.65/GJ (US$2.23/MMBtu) this year, C$2.95/GJ (US$2.48/MMBtu) in 2016, and C$3.05 (US$2.56/MMBtu) in 2017. The NEB’s mid-range Canadian outlook is for C$2.85/GJ (US$2.39/MMBtu) this year, C$3.15 (US$2.65/MMBtu) in 2016, and C$3.35/GJ (US$2.81/MMBtu) in 2017.
(American translations of Canadian prices are always open to change due to currency fluctuations, and also reflect a difference in standard production unit sizes. The exchange rate is currently C$1.00 equals US$0.80. One MMBtu equals 1.05 GJ.)
In all cases the NEB predicts Canadian gas production capacity to remain well below its 2005 peak of an average 17 Bcf/d, in a range down from the bygone high by eight per cent to 18% depending on how prices turn out.
In the high-price scenario, Canadian deliverability gradually climbs from 14.7 Bcf/d in 2014 to 15.1 Bcf/d this year, 15.1 Bcf/d again in 2016, and 15.6 Bcf/d in 2017.
Under low prices, Canadian gas capacity steadily deteriorates to 14.6 Bcf/d this year, 14 Bcf/d in 2016, and 13.9 Bcf/d in 2017.
In the NEB’s mid-range price scenario, deliverability changes marginally to 14.8 Bcf/d this year, 14.4 Bcf/d in 2016, and back to 14.7 Bcf/d in 2017.
The lone bright spot for gas in the NEB outlook is 6% growth in western Canadian demand to 5.3 Bcf/d as of 2017 due to increasing consumption by Alberta thermal oil sands projects.
Eastern Canadian demand barely budges, rising marginally to 3.9 Bcf/d in 2017. The NEB predicts U.S. exporters will continue to command a growing share of the eastern Canadian market after more than doubling northbound cross-border deliveries into a range of 2.1-2.5 Bcf/d since the 2007 onset of high-volume shale production.
But the NEB also warns producers and merchants to brace for more surpluses and price weakness if one or more of the 18 contenders to build liquefied natural gas (LNG) export terminals on the Pacific coast advances into construction.
LNG exports are expected to relieve supply gluts eventually. But in Canada, the initial effect of success at landing an overseas gas-sales contract is expected to be immediate acceleration of drilling in order to build up reserves needed to fulfill the deal.
Added production is forecast to flow back into North American markets during an extended period of export tanker terminal construction that would follow an overseas marketing breakthrough. All the LNG proposals rely on developing new supply fields in northern British Columbia shale deposits with horizontal drilling and hydraulic fracturing.
© 2024 Natural Gas Intelligence. All rights reserved.
ISSN © 1532-1231 | ISSN © 2577-9877 |
