Physical Natgas Eases; Analysts Seek to Avoid Storage Report Misfires
Prices for physical natural gas to be delivered Thursday were quiet in Wednesday’s trading, with most points fluctuating within a few pennies of unchanged. Buyers for electrical power generation had little incentive to purchase incremental volumes as next-day peak power prices fell modestly. Overall, the National Spot Gas Average was down a penny at $2.29.
Futures slumped ahead of the weekly Energy Information Administration (EIA) inventory report as estimates began lining up for an expected build well ahead of long-term averages.
At the close, July had eased 6.4 cents to $2.634 and August had dropped 6.2 cents to $2.663. July crude oil fell $1.62 to $59.64/bbl.
Traders were surprised at the drop in the futures.
“Typically we get a bounce at the beginning of hurricane season, but not so,” said a New York floor trader. “I just got the lowest natural gas bill of my life. I know we aren’t using much, but the price to consumers has dropped a lot.”
As far as technical support and resistance, “you would have to look at the big numbers, $2.50 and maybe $2.25, but I find it hard to believe we are going much lower than this. I would have thought prices would be higher. What did we do? Spend a couple of days above $3.
“There was no question it was a short covering rally, and the funds may have some room for further short sales, but you would have to be leery,” the trader said.
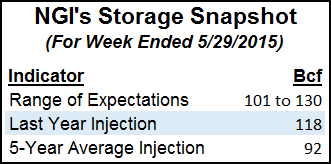
Thursday’s EIA inventory report for the week ending May 29 will definitely attract buyers and sellers eager to capitalize on any figure that comes in higher or lower than expectations, and with hefty triple-digit builds on the agenda, misses are likely to have greater girth.
Last year a plump 118 Bcf was injected and the five-year average is for a 92 Bcf increase. For the week ended May 29, the figures are coming in higher. Citi Futures Perspective is looking for an increase of 125 Bcf, and United ICAP calculates a 126 Bcf build. A Reuters poll of 25 traders and analysts revealed an average 121 Bcf with a range of 101 Bcf to 130 Bcf.
That said, analysts are viewing the estimates with a bit of trepidation as last week estimates were swirling around 100 Bcf and the actual figure came in at a whopping 112 Bcf, a relatively unheard of miss of 12 Bcf. The maximum tallied in the Reuters survey was 107 Bcf.
“Our early view survey for this week came in at 121 Bcf, and I think the bias is higher,” John Sodergreen, editor of Energy Metro Desk, told NGI as he began collating his final numbers.
“Last week was high and it was a crazy misfire. No one is quite sure why as we have had two misses out West, and the West is the most transparent area in the country.
“In theory there is no such thing as a true-up. These are supposed to be everyone’s actual flow numbers, but the fact is that there are true-ups. If you look at the last two weeks of misses and average them, they come out about right. No one can explain that either. The theory goes that this week should be close to where the market is.”
Market technicians following Elliott Wave and retracement analysis lean toward interpreting their charts and data as representing a market struggling to put in a bottom. The operative word, however, may be struggling.
There’s “no evidence of bottoming action on the technicals. However, we do have the essence of a hammer bottom on the daily candlestick chart,” said Brian LaRose, a market technician at United ICAP. “If a reversal is brewing, the first step will be to confirm Tuesday’s hammer with a rally Wednesday. No rally, no bottom. In this situation we still prefer to be scale-down buyers with a protective sell stop beneath the $2.443 low.”
Fundamentals analysts, however, contend that increased industrial demand, exports to Mexico, and a higher power burn will not balance what they see as an oversupplied market.
Recent market strength has been because of short-covering rather than any fundamental tightening, said Barclays analyst Michael Cohen. “But that rally is now firmly in the rear-view mirror, and barring any large supply disruptions, we continue to see prices trading below the $2.80/MMBtu range.
“Storage now stands at 2,101 Bcf, just 18 Bcf below the five-year average. Given the milder weather, we expect another large build [this] week, which would catapult inventories to or above the five-year average of 2,211 Bcf. Storage levels trading within the five-year average have been rare in recent years. The last time inventories approached the five-year average was on Feb. 13, 2014, and before that, Nov. 22, 2013.”
Barclays view “is that prices will succumb to a rising flood of Northeast natural gas. Despite some production hiccups in the Northeast this week, U.S. gas production is holding steady at around 72 Bcf/d, according to initial pipeline scrapes. Notably, the gas-directed rig count is down some 32% from the start of the year. Although production levels have come off their peak of around 74 Bcf/d in December, current levels are still up 5% year-on-year.”
There are encouraging signs that “sources of incremental demand are beginning to chip away at the supply overhang,” Cohen said. “These include higher power burns, increased pipeline exports to Mexico and steady demand from the industrial sector. However, these factors on their own will not balance the market. We assume normal weather in our outlook. Anything milder will result in downward pressure on prices and vice-versa.”
In physical market trading, eastern points took the day’s greatest hits. Gas at the Algonquin Citygates shed 15 cents to $1.30, and gas on Iroquois Waddington fell 13 cents to $2.35. Deliveries to Tennessee Zone 6 200 L shed 6 cents to $1.43.
Gas headed for New York City on Transco Zone 6 fell 16 cents to $1.67, and parcels on Tetco M-3 changed hands 3 cents lower at $1.25.
Major hubs traded a few pennies higher. Gas at the Chicago Citygates was quoted flat at $2.58, and deliveries to the Henry Hub added 2 cents to $2.64. At Opal, Thursday deliveries came in at $2.42, up 2 cents, and at the SoCal Citygates next-day gas was seen 3 cents higher at $2.68.
Next-day peak power prices offered little incentive to purchase additional natural gas for power burn. Intercontinental Exchange reported that peak power at the ISO New England’s Massachusetts Hub for Thursday eased $1.87 to $19.19/MWh, and gas on the New York ISO’s Zone G (eastern New York) delivery point fell $10.50 to $20.00. At the PJM West Hub, on-peak Thursday power was quoted 31 cents lower at $30.55/MWh.
© 2024 Natural Gas Intelligence. All rights reserved.
ISSN © 1532-1231 | ISSN © 2577-9877 |