EPA Report Shows Some Progress on Reducing Methane Emissions
Methane emissions from natural gas production have fallen about 38% since 2005, but emissions from processing increased by about 38% since that year, and rose about 11% from gas transmission and storage sources, according to a report released Wednesday by the U.S. Environmental Protection Agency (EPA).
Meanwhile, EPA said methane emissions from hydraulically fractured gas wells had declined about 79% since 2005.
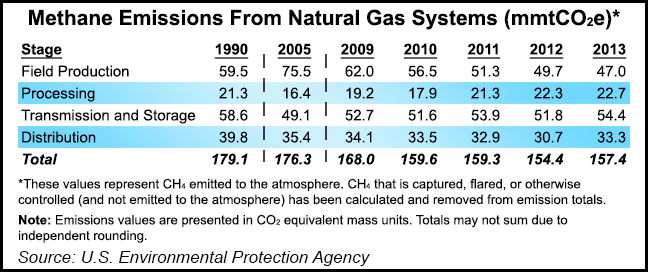
According to the 89-page Energy chapter of the agency’s U.S. Greenhouse Gas Inventory Report: 1990-2013, overall methane emissions from natural gas systems totaled 157.4 million metric tons of carbon dioxide equivalent (mmtCO2e) in 2013, a 10.7% decrease from 176.3 mmtCO2e in 2005. However, emissions were 1.9% higher than 2012, which totaled 154.4 mmtCO2e.
Broken down by stage, methane emissions from the field production of natural gas totaled 47.0 mmtCO2e in 2013, a 37.7% decrease from 2005 (75.5 mmtCO2e). Emissions attributed to the distribution stage for natural gas also declined, by 5.9%, during the same time frame — from 35.4 mmtCO2e in 2005 to 33.3 mmtCO2e in 2013.
But methane emissions increased 38.4% from natural gas processing between 2005 and 2013, from 16.4 to 22.7 mmtCO2e, respectively, as did emissions from natural gas transmission and storage, which increased 10.8% between 2005 (49.1 mmtCO2e) and 2013 (54.4 mmtCO2e).
The data shows that on a year-to-year (y/y) basis, methane emissions increased in three of the four aforementioned stages. Between 2012 and 2013, emissions from field production fell 5.4% (from 49.7 to 47.0 mmtCO2e), but emissions from processing rose 1.8% (from 22.3 to 22.7 mmtCO2e), as did emissions from transmission and storage (up 4.8%, from 51.8 to 54.4 mmtCO2e) and distribution (up 7.8%, from 30.7 to 33.3 mmtCO2e).
All of the aforementioned figures represent methane emitted to the atmosphere. According to EPA, methane that is captured, flared or otherwise controlled — and not emitted to the atmosphere — has been calculated and removed from the emission totals.
In its analysis, EPA said methane emissions from field production had actually declined 21% between 1990 (59.5 mmtCO2e) and 2013, but the trend didn’t last — emissions increased through 2006, mostly from pneumatic controllers and the hydraulic fracturing (fracking), completions and workovers of gas wells. But emissions declined from 2007 to 2013.
“[The] reasons for the 2007 to 2013 trend include an increase in plunger lift use for liquids unloading, increased voluntary reductions over that time period — including those associated with pneumatic controllers — and increased reduced emissions completions [REC] use for well completions and workovers with [fracking].” The workovers were a result of New Source Performance Standards (NSPS) for oil and gas, released in 2012 (see Daily GPI, June 6, 2012), and from voluntary reductions.
According to EPA, processing plants account for 14% of methane emissions and 58% of non-combustion carbon dioxide (CO2) emissions from natural gas systems. Methane from processing increased by 6.5% from 1990 (21.3 mmtCO2e) “as emissions from compressors increased as the quantity of gas produced increased,” EPA said, but it added that CO2 emissions fell 21.6% between 1990 and 2013 (from 27.8 to 21.8 mmtCO2e) “as a decrease in the quantity of gas processed resulted in a decrease in acid gas removal emissions.”
EPA said compressors and dehydrators were the primary source of methane emissions in the transportation and storage stage, accounting for 34.6% of total emissions from natural gas systems. Methane emissions decreased by 7.1% between 1990 (58.6 mmtCO2e) and 2013 “due to increased voluntary reductions (e.g., replacement of high bleed pneumatics with low bleed pneumatics),” the agency said.
In the distribution stage, EPA said “an increased use of plastic piping, which has lower emissions than other pipe materials, has reduced both methane and CO2 emissions.” Methane emissions fell 16.3% between 1990 (39.8 mmtCO2e) and 2013.
EPA said energy-related activities were the primary sources of anthropogenic GHG emissions in the U.S., accounting for 84.5% of total greenhouse gas (GHG) emissions on a CO2 equivalent basis in 2013. That figure included 97% of the nation’s CO2 emissions, 41% of methane emissions and 12% of nitrous oxide (N2O) emissions.
According to EPA, emissions from fossil fuel combustion accounted for the far majority of energy-related emissions, with CO2 being the primary gas emitted, at 5,158 mmtCO2e. The agency said that on a global scale, 32,310 mmtCO2e were added to the atmosphere through the combustion of fossil fuels in 2012; the U.S. accounted for approximately 16% of that.
Enteric fermentation — methane produced by animals, especially cattle and deer — continued to occupy the spot of top methane producer, totaling 164.5 mmtCO2e. Natural gas systems were in second place (157.4 mmtCO2e). Petroleum systems were in sixth (25.3 mmtCO2e).
In a three-page Inventory — officially, theInventory of U.S. Greenhouse Gas Emissions and Sinks 1990-2013: Revision to Hydraulically Fractured Gas Well Completions and Workovers Estimate — EPA said national emissions by hydraulically fractured wells declined 78.6%, from 403,335 metric tons (mt) of methane in 2005 to 86,392 mt in 2013.
Industry groups praised the results of the report. In a statement Wednesday, the American Petroleum Institute (API) seized on the 37.7% decrease in methane emissions between 2005 and 2013.
“The latest inventory shows that U.S. producers continue to make dramatic improvements,” said Howard Feldman, API senior director for regulatory and scientific affairs. “These voluntary efforts will continue, as operators work to capture more gas and deliver it to consumers.
“Another layer of burdensome regulations will only interfere with that progress,” Feldman added, taking a swipe at the Department of Interior’s proposed rules governing fracking on public land (see Shale Daily, March 17).
Energy In Depth (EID) — an industry-backed national shale gas education initiative launched by the Independent Petroleum Association of America (IPAA) — also chimed in. In a blog post Wednesday, EID’s Katie Brown said that “while emissions from the entire natural gas supply chain increased slightly in 2013, emissions from the actual production phase decreased dramatically, as EPA’s inventory clearly shows. Interestingly, the Obama administration’s proposed new rules for fracking primarily target the production phase.”
But EPA’s report also had something for environmental groups to take hold of. Mark Brownstein, associate vice president for the Environmental Defense Fund (EDF), pointed out that on a y/y basis, overall methane emissions from natural gas systems rose between 2012 and 2013.
“The oil and gas industry has been quick to tout their small victories in minimizing methane pollution, but there’s always a catch,” Brownstein wrote in a blog post Wednesday. “In fact, according to EPA today, the only sector of the natural gas supply chain where emissions have decreased is the production phase. What [the] industry is not as quick to point out is that those emissions dropped as a direct result of EPA regulations of hydraulically fractured gas wells.”
© 2024 Natural Gas Intelligence. All rights reserved.
ISSN © 2577-9877 | ISSN © 1532-1266 | ISSN © 2158-8023 |