E&P | NGI All News Access | NGI The Weekly Gas Market Report
Lower 48 NatGas Production Up 0.9% in November; Shale Surge Continues
Natural gas production in the Lower 48 was up marginally in November to 81.54 Bcf/d, an increase of 0.76 Bcf/d (0.9%) compared to the previous month, with the latest in a long string of impressive months in the shale-rich Other States category overcoming month-to-month downturns or nearly flat performances in several other areas, according to the Energy Information Administration (EIA).
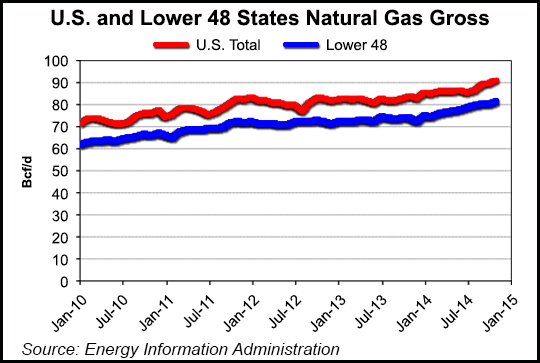
Total U.S. production was 90.95 Bcf/d in November, up 1.6% from October, according to EIA’s latest Monthly Natural Gas Gross Production Report (see Daily GPI,Jan. 2). Production in the Lower 48, while up only a fraction from October, was up a robust 7.13 Bcf/d compared with 74.41 Bcf/d in November 2013.
The bulk of that year long production surge came from Other States, which reached 33.26 Bcf/d in November, an increase of 0.93 Bcf/d (2.9%) compared with October and up a whopping 6.17 Bcf/d 23% compared with November 2013. The increase over the previous month came “primarily because of new wells coming online and shut-in wells coming back on line,” EIA said.
Alaska also saw an increase in November, reaching 9.41 Bcf/d, up 0.67 Bcf/d (7.7%) compared with October. It was the largest production number for the state since March (9.65 Bcf/d), and a slight increase compared with November 2013 (9.33 Bcf/d).
Natural gas production in New Mexico moved upward slightly, to 3.53 Bcf/d, compared with 3.45 Bcf/d in October, and production in Wyoming was nearly flat at 5.52 Bcf/d, compared with 5.50 Bcf/d in the previous month.
But three other states, including Texas, and the federal offshore Gulf of Mexico (GOM) all reported natural gas production declines in November compared with October, though the declines weren’t steep. Production in the GOM was 3.35 Bcf/d, compared with 3.51 Bcf/d in October; Louisiana posted 5.30 Bcf/d, compared with 5.36 Bcf/d in October; production in Oklahoma was 6.54 Bcf in November, compared with 6.55 Bcf/d in the previous month, and Texas reported 24.04 Bcf/d, down from 24.07 Bcf/d.
Some observers looking at the EIA report and chronically low natural gas prices “may be missing supply-demand fundamentals that in our view are increasingly painting a disturbing picture,” said analysts at Wells Fargo.
“Under the old paradigm, price drove the rig count, which in turn drove supply, but the rapid development of unconventional shale gas has severed these historical ties,” the Wells Fargo analysts said in a note Monday. “Gas plays like the Barnett and Haynesville led the initial charge while the monster that is the Marcellus got its feet under it. Operator knowledge gained in the first stage of activity led to faster ascents of the learning curve in Appalachia. The combination of experience, high quality rock, and a lack of demand growth has meant that the past few years of Marcellus (and now Utica) growth have increasingly pushed equilibrium further to the right…
“Unless polar vortexes, record blizzards, and the like occur more frequently through the end of winter it is not difficult to imagine a storage system filled to the gills with gas. Although that is a few months out, in our recent conversations with industry, it is already not uncommon to hear $1 gas mentioned for volumes stuck in the most bottlenecked areas of the Marcellus. The issue is largely localized for now, but until petchem, LNG and other industrial demand arrive in meaningful numbers (2017+), severe dislocations in absolute prices and basis seem like real possibilities.”
EIA received approval from the Office of Management and Budget in November to add state-level data from 10 states, including some of the most shale-rich names in the Other States category (see Daily GPI, Nov. 12). The new surveys, which collect state-level data from Arkansas, California, Colorado, Kansas, Montana, North Dakota, Ohio, Pennsylvania, Utah and West Virginia, were scheduled to begin last month, with resulting data likely to be released beginning by mid-2015.
© 2024 Natural Gas Intelligence. All rights reserved.
ISSN © 1532-1231 | ISSN © 2577-9877 | ISSN © 1532-1266 |