Markets | NGI All News Access | NGI The Weekly Gas Market Report
Natural Gas Marketers 3Q2014 Total Slips 2%; BP Extends Lead
BP plc reported a 7% increase in North American natural gas marketed compared to the year-ago period and had more than double the sales transaction total of its nearest competitor in the third quarter of 2014. Half of the other companies participating in NGI‘s 3Q2014 Top North American Gas Marketers Ranking reported decreased sales compared with 3Q2013, leading to a lower overall total.
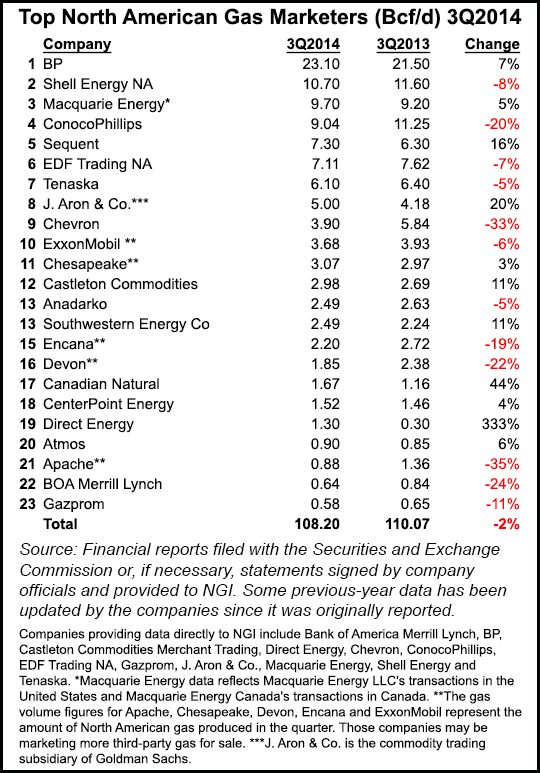
Twenty-three leading gas marketers reported combined sales transactions of 108.20 Bcf/d for 3Q2014, with six of the survey’s top 10 marketers and 12 companies overall reporting lower numbers than in 3Q2013. A year ago those same companies reported 110.07 Bcf/d in sales. Note these sales numbers do not reflect production, which has been rapidly expanding. The survey reflects trading in which a single package of gas may be sold several times over between the wellhead and the burnertip.
NGI‘s 1Q2014 survey found a 0.5% increase compared with 1Q2013, a small rebound for a sales market that had been on a downward slope for nearly two years (see Daily GPI, June 12). But the survey total dipped back into decline compared to year-ago numbers in 2Q2014 (see Daily GPI, Sept. 12).
Persistently low prices which leave little room for margin could be discouraging marketers efforts to trade natural gas. The Energy Information Administration (EIA) has projected Henry Hub prices to average just $3.98/MMBtu this winter and $3.83/MMBtu in 2015 (see Daily GPI, Dec. 9).
“It will be extremely difficult for natural gas prices to rebound much in the short term if two things don’t happen,” said Patrick Rau, NGI director of strategy and research. “One is winter weather, which is no secret. Natural gas in storage continues to eat away at the deficit it had to last year and the previous five-year average, and will likely continue to do that. Remember, there were some massive withdrawals from the polar vortex last winter, so unless there are similar withdrawals this winter, which is asking a lot, it will be difficult for storage to continue showing a deficit to last year and historical norms.”
And the pace of natural gas production will have to slow, which may also take some time, Rau said. “Lower 48 marketed production continues to climb on a year-over-year basis. EIA data show September Lower 48 marketed production was up 7.5% year over year, the highest monthly Y/Y advance since early 2012. But the recent collapse in oil prices should help slow the pace in natural gas production, at least to some degree. Much of the recent increase in marketed gas production has come in the form of associated gas from crude oil, and no doubt drillers will start laying down some oil rigs in the months ahead. But it will likely take several months for a slowdown in capex spending to translate to lower natural gas production, so my guess is the industry will still be awash in supply for the first half of 2015, at least.”
However, Rau said there may be a market to help absorb all that extra gas. “There’s nothing like lower gas prices to help solve lower gas prices, especially among power producers. Recent history shows that when natural gas prices fall below coal prices on an MMBtu equivalent basis, power generators are quick to burn more gas. Plus, many coal-fired plants are being decommissioned by 2016 ahead of the MATS (mercury and air toxics) standards, so that should help shrink the gas supply bubble as well.”
In the latest NGI survey, BP reported 23.10 Bcf/d, a 7% increase from 21.50 Bcf/d in 3Q2013. The London-based major posted a 19% decline in third quarter profits from a year ago, in part impacted by the global oversupply in crude oil, and in part on a huge drop in profits from its near-20% stake in Russia’s OAO Rosneft (see Daily GPI, Oct. 28). Lower commodity prices cut into the upstream division’s profits, the company recently reported. As part of its wider ongoing group-wide program to simplify across its upstream and downstream activities and corporate functions, BP expects to incur $1 billion in non-operating restructuring charges over the next five quarters (see Daily GPI, Dec. 10). And the company continues to deal with repercussions from its 2010 Macondo well blowout in the deepwater Gulf of Mexico (see Daily GPI, Dec. 8).
Other Top 10 marketers reporting increases compared with 3Q2013 were Macquarie Energy (9.70 Bcf/d, up 5%), Sequent (7.30 Bcf/d, up 16%) and J. Aron & Co. (5.00 Bcf/d, up 20%).
Numbers were down across the rest of the survey’s upper echelon. Shell Energy NA reported 10.70 Bcf/d, down 8% compared with 3Q2013, and declines were also reported by EDF Trading NA (7.11 Bcf/d, down 7%), Tenaska (6.10 Bcf/d, down 5%), Chevron (3.90 Bcf/d, down 33%), and ExxonMobil (3.68 Bcf/d, down 6%).
The largest decline for the sixth consecutive month came at ConocoPhillips, which reported 9.04 Bcf/d, down 2.21 Bcf/d (20%) from 11.25 Bcf/d in 3Q2013. Such double-digit declines, which ConocoPhillips first reported in NGI‘s 1Q2013 survey, are primarily due to the implementation of business model restructuring in North America following the spin-off of downstream operations in 2012 (see Daily GPI, April 17, 2012) and the company’s view of market conditions.
The plan appears to be paying off: ConocoPhillips is on track to achieve 3-5% volume and margin growth in 2014, and the Houston-based oil independent’s 2Q2014 production was up 6.5% compared with 2Q2013, although much of the gain was attributed to the company’s increasing emphasis on oil production (see Shale Daily, July 31). Earlier this month, ConocoPhillips said it was slashing its 2015 capital spending by 20%, significantly more than it had previously estimated (see Shale Daily, Dec. 8). Even with lower spending, however, production still is projected to increase by about 3% year/year on continuing operations, the company said.
Not appearing in the survey for the first time in four years is JPMorgan, which completed the sale of its physical commodities business to Mercuria Energy Group Ltd. in early October. JPMorgan said last year it was planning to exit the physical commodities business, including its remaining holdings of commodities assets and its physical trading operations (see Daily GPI, July 29, 2013), and the $3.5 billion all-cash transaction with Mercuria was announced earlier this year (see Daily GPI, March 19).
Privately-held Mercuria does not release sales data. “Our financials are confidential and exclusively available to our direct counterparty relationship dealings,” a Mercuria official told NGI.
Larnaca, Cyprus-based Mercuria claims to be one of the largest integrated energy and commodity trading companies in the world (see Daily GPI, June 4, 2009). Trading activities are managed through Mercuria Energy Group Holding SA of Geneva.
JPMorgan ranked ninth on NGI‘s Top North American Gas Marketers Survey for 2Q2014, transacting 4.57 Bcf/d during the quarter. The bank placed ninth for full-year 2013, doing 5.54 Bcf/d (see Daily GPI, March 14). JPMorgan’s gas commodities business in 2012 ranked 10th based on FERC 552 data of top marketers by volume of natural gas bought and sold (see Daily GPI, June 5).
Highlights of NGI‘s 3Q2014 Top North American Gas Marketers Ranking include a 3% increase for Chesapeake (3.07 Bcf/d, compared with 2.97 Bcf/d in 3Q2013), an 11% increase for Castleton Commodities (2.98 Bcf/d, compared with 2.69 Bcf/d in 3Q2013), an 11% increase for Southwestern Energy Co. (2.49 Bcf/d, compared with 2.24 Bcf/d in 3Q2013), a 44% increase for Canadian Natural (1.67 Bcf/d, compared with 1.16 Bcf/d in 3Q2013) and a more than three-fold increase for Direct Energy (1.30 Bcf/d, compared with 0.30 Bcf/d in 3Q2013).
On the other side of the coin, Anadarko reported a 5% decline; Encana Corp. a 19% decline; Devon a 22% decline; Apache a 35% decline; and BOA Merrill Lynch a 24% decline.
The NGI survey ranks marketers on sales transactions only. The Federal Energy Regulatory Commission tallies both purchases and sales. FERC’s combined buy/sell volumes were 118,099 TBtu in 2013, down 4.7% from the prior year, according to an analysis by NGI of 2013 Form 552 buyer and seller filings.
© 2024 Natural Gas Intelligence. All rights reserved.
ISSN © 1532-1231 | ISSN © 2577-9877 | ISSN © 1532-1266 |