Infrastructure | NGI All News Access | NGI The Weekly Gas Market Report
Appalachia Pipelines See Most Capacity Trading Action
The latest data from Capacity Center on the top pipeline capacity traders show that Marcellus/Utica shale country is the most active region for pipeline capacity trading as asset management agreement (AMA) deals between producers and marketers have grown larger and longer in term.
This year’s Capacity Center report again covers the period January through August, but it adds a ranking of the top 20 pipelines for capacity trading. Among these, the top five pipelines for volume of capacity traded on a daily equivalent basis all serve the Appalachia region: Transcontinental Gas Pipe Line (Transco), Columbia Gas Transmission, Texas Eastern Transmission, Tennessee Gas Pipeline and Dominion Transmission.
That’s not surprising, the firm said, given the robust production coming from Appalachia, the number of pipeline projects to serve that production, as well as the mature and active state of retail unbundling in the Northeast.
Capacity Center President Greg Lander told NGI there have been many AMAs between producers and capacity aggregators/marketers involving the capacity positions that producers took in pipeline projects that have already come online. “We will see even more,” he said.
While a producer will acquire pipeline capacity to get its gas to higher-priced markets, it might not be inclined to build up the marketing operation that is necessary to make that happen. In this case, the producer will hand its pipeline capacity and gas over to a marketer and let the marketer do the job.
In Appalachia, this is showing up in the volumes of traded capacity on the pipes serving the region. Transco, for instance, the No. 1 pipeline for capacity trading, had nearly 4,500 deals during the first eight months of the year, according to Capacity Center. These deals accounted for a total of more than 1.7 Tcf of traded capacity, or nearly 2.5 Bcf on a daily equivalent basis.
The total traded volume represents the capacity per day multiplied by the number of days (regardless of term), while the daily equivalent measure caps the duration of a trade at 365 days in order to derive an apples-to-apples comparison of daily controlled capacity — where a 10-day deal for 100,000 Dth/d has the same equivalent controlled capacity as a 100-day deal for 10,000 Dth/d, according to the Capacity Center methodology.
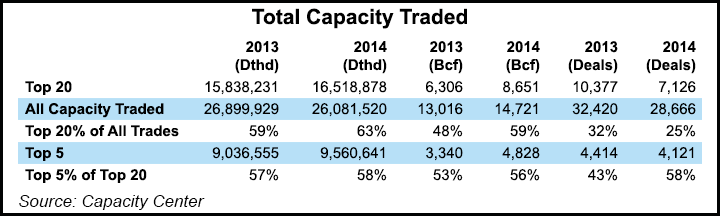
In the ranking period of January through August, the top 20 companies traded a total volume of 8.65 Tcf of capacity for 59% of the 14.7 Tcf total traded, according to Capacity Center, which is a unit of Skipping Stone LLC. This represents an 11% increase from 2013, when during the January-August period the top 20 traded 6.3 Tcf, or 48% of the 13.01 Tcf total. These figures saw a rise in both the percentage traded by the top 20 and the overall amount of gas capacity traded in 2014 over 2013.
This year, in the daily equivalent category, the top 20 companies traded 63% of the total of all traders, which is 16.5 Bcf/d of the 26.08 Bcf/d traded. Although the 2014 volumes are up among the top 20, from 15.8 Bcf/d in 2013, the 2014 total of 26.08 is off slightly from the previous record-breaking 26.889 Bcf/d traded in 2013.
As in previous year-over-year comparisons, the concentration in the top 20 has increased again with their trading volumes totaling 63% of daily equivalent and 59% of total capacity up from 59% and 48% respectively in 2013, according to Capacity Center. The concentration of the top five within the Top 20 remained essentially unchanged at around 58% in all categories, while the daily equivalent separating 11th-ranked Macquarie from 20th-ranked Duke Energy Unregulated was only slightly more than 115,000 Dth/d compared to last year’s 130,000 Dth separating No.11 Exelon Unregulated from No. 20 Scana Unregulated.
Individual deals were larger and longer in 2014 compared with 2013, resulting in a drop in the number of deals done for each study period (from 32,420 to 28,666). “Against this backdrop, it is also notable that EIA [Energy Information Administration] statistics show daily production of gas reaching approximately 70 Bcf/d and that Capacity Center statistics indicate just over 37% of this volume is flowing through the 26.08 Bcf/d of daily equivalent secondary market capacity. This is nearly 240% higher than the amount of daily equivalent reported in 2009 (10.9 Bcf/d),” the firm said.
“Capacity release is a fundamental piece of the market,” Lander said. “…[I]f [nearly] 40% of the flowing gas is flowing through released capacity, that’s huge…I think there’s a likelihood that you’ll see it grow as these new projects come on and AMAs are there. What I think we’ll see is sort of a permanent feature somewhere between 40 and 50% but that the total gas production goes up, the volume will go up.”
As new pipeline projects come online, principals in those projects will be doing more AMAs with marketing companies, Lander said. Depending upon what happens with efforts to synchronize the natural gas and electricity markets, the secondary pipeline capacity market could see the entry of more electric players that choose to hold capacity themselves rather than rely on a marketer, he said.
While more electric players might be coming into the capacity market, it’s clear from this year’s ranking that the banks have made their way out. “…[Y]ou don’t get to a bank until No. 11, which is Macquarie [Energy],” Lander said, “J Aron [and Co.] at 13, and that’s it…Now you’re seeing the mega marketers and the producer-marketers.”
© 2024 Natural Gas Intelligence. All rights reserved.
ISSN © 1532-1231 | ISSN © 2577-9877 | ISSN © 1532-1266 |