Texas Upstream Boomed Again in September, But Slowdown Seen Coming
September set another record for upstream oil and gas activity in the Lone Star State, but weakened oil prices indicate that a slowdown could be coming — how significant remains to be seen, said a Texas economist specializing in energy patch data.
“Clearly the decline of oil prices suggests the current expansion of oil and gas drilling and development activity that began in January 2010 might be about to come to an end,” said Karr Ingham, the economist who created industry barometer Texas Petro Index (TPI) and maintains it for the Texas Alliance of Energy Producers. “Any slowdown — and the depth and length of that slowdown — will depend entirely upon how far prices fall and how long they remain relatively low.”
Looking back to September, the party was in high gear, with record permitting activity, record employment, and more than 900 rigs drilling on location, according to Ingham. For the month, the TPI hit a record of 312.3.
October brought falling leaves, and prices, though. Oil was at about $78/bbl around Halloween, Ingham said. The decline can be largely blamed on the success of the drillbit. “…[T]he oil-price decline is neither accidental nor random. It is the result of the spectacular crude oil production increases achieved by operators in Texas and all across North America in recent years, with assistance from sluggish economic conditions keeping a lid on energy-demand growth.
“This is how markets are supposed to work: high prices stimulate additional production, which in turn stabilizes prices or pushes them lower. That is exactly what is happening now.”
Ingham said the benefit of lower oil prices to U.S. consumers, in the form of lower gasoline prices, was just one direct, beneficial outcome. “More of our energy is being produced here at home; crude oil imports have been cut well more than in half and more of what we do import comes from Canada. In fact, this, in part, is what energy independence looks like in the U.S., and isn’t this the outcome we have wanted as consumers?”
A composite index based upon a comprehensive group of upstream economic indicators, the TPI in September was 312.3, up 6% compared to September 2013. Before the current economic expansion, the TPI’s previous all-time high of 287.6 occurred in September and October 2008, after which the TPI declined to 188.5 in December 2009 before embarking upon the current growth cycle.
Crude oil production in Texas totaled an estimated 94 million bbl, about 23.6% more than in September 2013. With crude oil prices in September averaging $89.57/bbl, the value of Texas-produced crude oil totaled nearly $8.4 billion, 7.6% more than in September 2013.
Estimated Texas natural gas output was nearly 680.2 Bcf, a meager year-over-year monthly increase of about 0.3%. With natural gas prices in September averaging 3.92/Mcf, the value of Texas-produced gas increased 13.3% to about $2.66 billion.
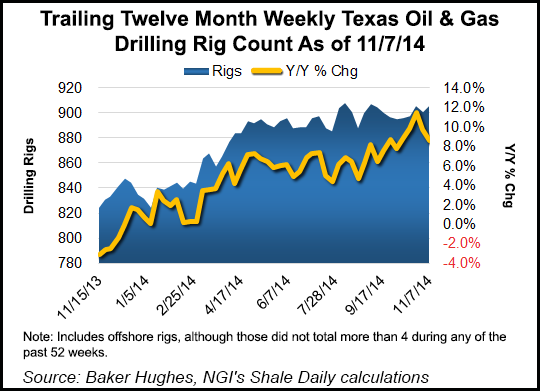
The Baker Hughes count of active drilling rigs in Texas averaged 902, increasing 7.8% from 837 active rigs in September 2013. Drilling activity in Texas peaked in September 2008 at a monthly average of 946 rigs before falling to a trough of 329 in June 2009. During the current economic expansion, the statewide average monthly rig count peaked at 932 in May and June 2012.
The rig count in Texas has been fairly stable since Aug. 1, ranging from 888 to 907 with an average of 901. The latest rig count, as of Nov. 7, stood at 906.
The number of Texans on oil and gas industry payrolls averaged a record 309,400, according to Ingham’s analysis of Texas Workforce Commission data, about 9% more than in September 2013. Upstream oil and gas industry employment in Texas has increased steadily since falling to a nadir of 179,200 in October 2009. During the previous growth cycle, industry employment peaked at 223,200 in November 2008.
© 2024 Natural Gas Intelligence. All rights reserved.
ISSN © 2577-9877 | ISSN © 2158-8023 |