Markets | NGI All News Access | NGI Data | NGI The Weekly Gas Market Report
Weak Cash Market Outdoes Soft Futures; November Loses a Penny
Physical gas for Friday delivery continued to weaken in Thursday trading as low power demand proved pervasive throughout key eastern population centers and weather forecasts continued to hover near seasonal norms.
In the Northeast, prices endured double-digit losses, but overall losses ranged from a few pennies to about a nickel. A handful of locations did manage gains.
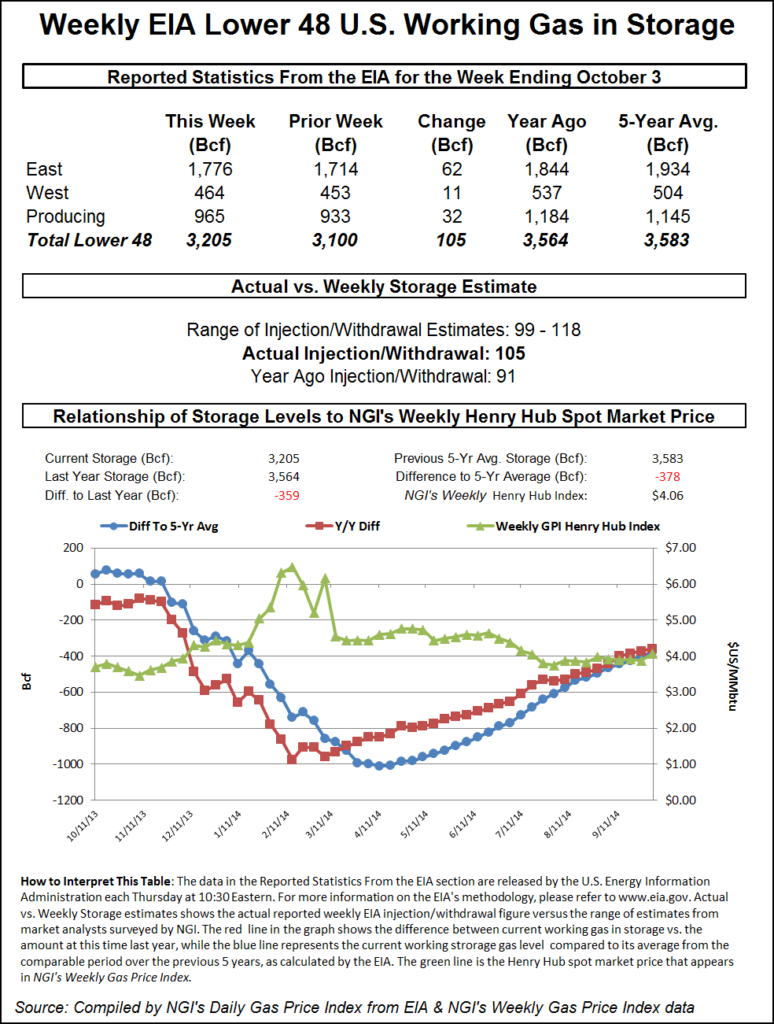
The same lethargy present in the cash market surfaced in the futures arena where even a mildly supportive inventory figure was unable to prompt a market rise. The Energy Information Administration reported a build of 105 Bcf, about 3 Bcf short of market expectations, but at the end of the day November was off 1.0 cent to $3.845 and December had skidded 1.4 cents to $3.937. November crude oil continued lower, dropping $1.54 to $85.77/bbl.
Next-day gas plunged as power loads and prices continued to wither in New England and the East. The New York ISO forecast that Thursday’s peak load of 18,596 MW would slide to 18,240 MW Friday and 17,163 MW Saturday. Farther south the expansive PJM Interconnection predicted that peak Thursday load of 31,325 MW would fall to 28,896 MW Friday and 27,963 MW Saturday.
Next-day power pricing followed suit. IntercontinentalExchange reported that peak Friday power at the ISO New England’s Massachusetts Hub fell $5.97 to $29.97/MWh and next-day peak power at the PJM West terminal dropped $1.44 to $39.35/MWh.
Temperature forecasts offered little incentive to buy next-day gas although active weather patterns were forecast to transgress eastern population centers.
Wunderground.com predicted the high Thursday of 65 degrees in Boston would hold Friday before sliding to 58 Saturday. The seasonal high in Boston is 64. New York City’s 68 high Thursday was seen falling to 63 Friday and Saturday, 3 degrees below normal. Baltimore’s 75 high on Thursday was expected to drop to 61 Friday and recover to 63 on Saturday. The normal early October high in Baltimore is 69.
The National Weather Service in Baltimore said, “a stationary boundary will develop over central Virginia tonight and it will remain nearby through Friday while it strengthens. Low pressure will ride along the boundary Friday night and high pressure will build in behind this system Saturday into Sunday. High pressure will move off the coast early next week and a strong cold front may impact the area during the middle portion of next week.”
The big declines in other petroleum markets over the past week have not gone unnoticed by traders. Spot crude oil in the last five trading sessions has dropped more than $5/bbl, or 6%, to under $86, and although natural gas is a North American market, large global swings are thought to have an impact. If nothing else, much European liquefied natural gas (LNG) is priced relative to crude oil, and a weakening LNG market overseas is not exactly music to the ears of North American producers.
“If you are a trader and you are trading commodities like oil and other products, natural gas is probably part of your portfolio and there is going to be a correlation between the two. You can probably make the case for a small psychological correlation,” said a Houston-based pipeline veteran. “Also, if the price of oil drops, does that change the price that someone is willing to pay for natural gas if it’s a fuel oil deal. Would they look at paying something less for natural gas?”
Friday deliveries of gas at Algonquin Citygates fell a stout 99 cents to $2.35, and gas at Iroquois Waddington dropped 75 cents to $3.08. On Tennessee Zone 6 200 L, Friday parcels changed hands at $2.73, down 72 cents.
Buyers of gas into New York and Philadelphia saw their quotes decline. Gas headed for New York City on Transco Zone 6 lost 15 cents to $1.83, and deliveries to Tetco M-3 shed 12 cents to $1.79.
Producing areas affected by Marcellus development weakened. Gas on Transco Leidy dropped 5 cents to $1.81, and gas on Tennessee Zone 4 Marcellus eased a penny to $1.74. Packages on Millennium were seen 2 cents lower to $1.81, and on Dominion South gas changed hands at $1.79, lower by 7 cents.
Analysts and traders were expecting a build in Thursday’s inventory report along the lines of the 112 Bcf reported last week. Last year, 91 Bcf was injected, and the five-year pace stands at 84 Bcf. Another sizeable reduction in the storage deficit seemed to be in the cards. Houston-based IAF Advisors projected an increase of 109 Bcf, and a Reuters poll of 23 traders revealed an average 108 Bcf with a range of 99-118 Bcf. Denver-based First Enercast was looking for 104 Bcf.
Industry consultant Genscape was looking for a 103 Bcf build and said in a Thursday morning report that “if realized it would mark the second consecutive +100 Bcf injection and maintain Genscape’s forecast for inventories to reach 3,556 Bcf by Nov.1. This week’s number is robust due to sustained production growth outpacing demand gains. Production during the week was fairly constant to slightly increasing, averaging 69.6 Bcf/d and reaching a high of 69.9 Bcf/d. Demand gradually increased during the week, growing from 56.3 Bcf/d on Sept. 27 to a peak of 64.0 Bcf/d on Oct. 2. A portion of the Lower 48 demand growth was met by increased imports from Canada as spreads from AECO to U.S. markets widened.”
The actual figure of 105 Bcf raised a few eyebrows. November futures rose to a high of $3.900 soon after the number was released and by 10:45 a.m. November was still trading at $3.900, up 4.5 cents from Wednesday’s settlement.
“The idea that traders were looking for was 109 to 110 Bcf and it came out 105 Bcf, not really all that much of a bullish indication,” said a New York floor trader. “We’re still at $3.75 to $4.00, and I don’t think this number will break us out of that range.”
Analysts at Citi Futures Perspective pegged the report as “slightly bullish.”
Inventories now stand at 3,205 Bcf and are 359 Bcf less than last year and 378 Bcf below the five-year average. In the East Region 62 Bcf were injected and the West Region saw inventories increase by 11 Bcf. Stocks in the Producing Region rose by 32 Bcf.
If degree-day forecasts are any guide, next week’s build report is likely to be plump as well. The National Weather Service (NWS) forecasts below-normal accumulations of combined heating and cooling degree day requirements for major population centers for the week ended Oct. 11. NWS expects New England to see 65 degree days, or 23 fewer than normal, and the Mid-Atlantic should experience 53 heating and cooling degree days, or 21 fewer than its normal tally. The greater Midwest from Ohio to Wisconsin is expected to see 81 combined days, or three more than normal.
In perusing the storage data, Phillip Golden, director of risk and product management at Energy Market Exchange in Houston, said, “We will need injection numbers of 55 Bcf/week to refill storage to the levels expected by the Energy Information Administration and to get to the high of 2012, we would need to average 176 Bcf/week. We are not going to reach either the high levels of 2012 levels nor are we going to be at the same level as last year.
“EMEX [Energy Management Exchange] projects that natural gas at the end of the injection season will be right around 3,525 Bcf, which will be the lowest level since 2008, where we entered the winter with storage at just over 3,400 Bcf. If we were to revert back to historical averages, we would end this injection season at just over 3,450 Bcf, which would be a very nice recovery from this past winter.”
Commodity Weather Group in its Thursday morning outlook reported that “while some cooler changes in the Midwest in the six-10 day offer some slight pickup, other changes to cool Texas and the West today lead to reduction in late-season lingering cooling demand. We also see some warmer changes to the East Coast at times in the six-15 day range that also reduce the demand situation.
“The pattern in the Pacific continues to be messy, with lots of variability that keeps the situation active over the U.S., but no major cold air transport mechanisms are being built at this time. With climatology gradually building heating demand through the balance of October, this pattern situation lends itself to reduced year-on-year demand as we saw a bigger cool push by Oct. 22-26 last year (which is now days 14-18),” said Matt Rogers, president of the firm.
© 2024 Natural Gas Intelligence. All rights reserved.
ISSN © 1532-1231 | ISSN © 2577-9877 | ISSN © 1532-1266 |